Polar Vector Plots
|
Click the Home | New Graph | Vector | Polar 2-Point Vector Plot or Home | New Graph | Vector | Polar 1-Point Vector Plot command to create a polar vector plot. Polar vector plots create vector lines between two points or from one point to the specified angle direction and with the selected magnitude. Click the Polar 2-Point Vector Plot or Polar 1-Point Vector Plot button to create a vector plot. |
|
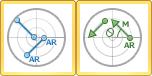
2-Point Vector Plots are created from four data columns. Two columns specify the starting angle and radius location. Two other columns specify the ending angle and radius location. A straight line with a vector arrow is drawn between the two points.
1-Point Vector Plots are also created from four data columns. Two columns specify the starting angle and radius location. Two other columns specify the direction and magnitude of the vector. A straight line is drawn from the starting angle and radius location in the direction specified with a length of the magnitude.

|
| Vector plots show data as straight-line segments. |
Creating a New Polar Vector Plot
To create a polar vector plot:
- Click the Home | New Graph | Vector | Polar 2-Point Vector Plot or Home | New Graph | Vector | Polar 1-Point Vector Plot command.
- Select a worksheet file in the Open Worksheet dialog. You can select a new data file or you can select an open worksheet file in the Open worksheets section.
- Click the Open button. A polar vector plot is created using the default properties.
Editing Polar Vector Plot Properties
To change the features of the polar vector plot, including the columns used to create the plot, first select the plot in the plot window or Object Manager and then edit its properties in the Property Manager.
Click the following tabs in the Property Manager to change different properties: