Plot Page - Piper Diagrams and Durov Plots
The piper and Durov diagram plot properties Plot page contains the options to change the data file and set data used in the anion and cation ternary plots. The piper diagram Diamond plot and the Durov plot Square plot do not have a Plot page. The Plot page also includes the classes for the piper and Durov class diagram. To view and edit properties, click on the anion ternary plot, cation ternary plot, diamond plot, square plot, pH plot, or TDS plot in the plot window or Object Manager to select it. Then, click on the Plot tab in the Property Manager.
Click one of the Plot page section names in the list below to read more information about the properties in those sections or follow this help topic sequentially to read about each property.
|
|
|
Set the X, Y, and Z data variables as well as class properties in the Plot page. |
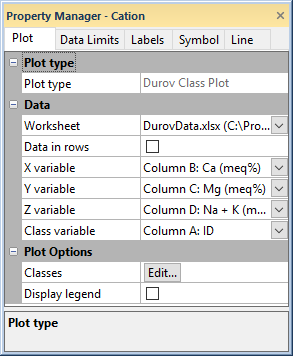
Plot Type
The Plot type property displays the type of plot.
Data
The Data section includes the data file and data specifications for the Cation and Anion plots in the piper and piper class diagram. The Diamond plot does not include the Data section, as the diamond plot points are defined by the cation and anion ternary diagram data.
Worksheet
Click the existing data file path and file name next to Worksheet to select a different data file for the plot. Click on a currently open worksheet or click the Browse option to navigate to a worksheet that is not yet open. Select a different data file in the Open Worksheet dialog, and click the Open button to change the data. The plot automatically updates.
NOTE: The worksheet columns are retained after changing the worksheet. If any of the column options are blank after changing the Worksheet, click on the blank option and select the desired column. A blank next to column means that the column does not exist in the new worksheet.
Data in Rows
Data in Rows
Select the Data in rows option if your data file is formatted where each row includes one variable. When the Data in rows option is selected, all plot properties that require data values are specified by selecting a data row. This includes variables such as X and Y, data labels, worksheet ranges, etc. Properties that list column letters will update to list row numbers. When switching from plotting data in columns to plotting data in rows, Grapher may not be able to select the correct rows automatically. Verify the correct rows are selected.
The property descriptions below refer to data columns, but when Data in rows is selected the property lists will include rows.
Variables
Click on the data name next to the X variable, Y variable, and Z variable fields to change the data used to create the plot. In the list that appears, select the new variable. If the first worksheet row contains header information, the header information appears next to the column letter.
In ternary diagrams, the three data sets for the X, Y, and Z fields must be normalized so that their sum is 1.0 or 100, i.e., 100 percent. Data that is not normalized to 1 or 100 is automatically normalized by Grapher when it is plotted. For example, values of 0.50, 0.75, and 0.25 would plot as 0.33, 0.50, and 0.17, respectively.
- In the X variable list, select the data to plot along the X axis. 100 percent is at the lower right corner.
- In the Y variable list, select the data to plot along the Y axis. 100 percent is at the upper corner.
- In the Z variable list, select the data to plot along the Z axis. 100 percent is at the lower left corner.
- In the Class variable list, select the data to classify the points. Numeric data can be used to classify the points by value. Text data can be used to classify the points by name, for example by sample location. You may need to convert numbers to text to use numeric values as a named class.
When the Class variable includes only numeric values, a default number of classes is automatically created and all data points are displayed in one of the classes. When the Class variable includes one or more text strings, the Class method is set to Name and the number of classes matches the number of unique text strings.
NOTE: The worksheet columns are retained after changing the worksheet. If any of the column options are blank after changing the Worksheet, click on the blank option and select the desired column. A blank next to column means that the column does not exist in the new worksheet.
Plot Options
The piper class diagram includes a Plot Options section in the Plot page. The Plot Options properties control the classes and display of the class legend. The Plot Options section is displayed for the Cation, Anion, and Diamond plots.
Classes
Click the Edit button next to Classes to launch the Edit Classes dialog, which allows you to edit class information.
Display Legend
Check the box next to the Display legend option to make the class plot legend visible. Remove the check mark to hide the legend. The legend display can also be changed in the Object Manager by checking or unchecking the display box.
Class plot legends cannot be copied and pasted. If a class plot legend should be copied, click on the legend to select it. Click the Graph Tools | Plot Tools | Detach Legend command to break the legend apart into multiple objects. The individual objects can be edited.