Edit Classes Dialog
The Edit Classes dialog allows you to define the classes used to group the data values in a classed scatter plot, a XYZ class scatter plot, a polar class scatter plot, a ternary class scatter plot, a piper class scatter plot, and a Durov class scatter plot. Each class is represented by a unique symbol in the scatter plot. Click on the scatter plot in the Object Manager or the plot window to select it. In the Property Manager, open the Plot page. To open the Edit Classes dialog and edit class information, click the Edit button next to the Classes option in the Plot Options section.
|
|
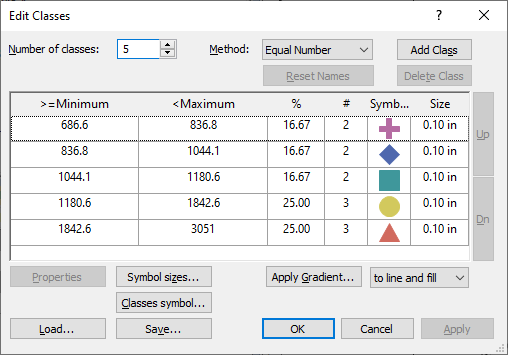
Use the Edit Classes dialog to define the classes used to group the data values. |
Number of Classes
The Number of classes value is used to specify how many classes or groupings should be on the plot. When you change the Number of classes value, the class list box is automatically updated to reflect the change. The Number of classes must be a whole number from 1 to 300.
When the Class column is numeric, a default number of classes is automatically created and all data points are displayed in one of the classes. When the Class column is a text string, the number of classes matches the number of unique text strings in the column where an X and Y value exist.
When the Number of classes is increased when the Method is set to Name, a new text class is automatically added if the Class column has any additional text items that are not currently a Class Name. If there are no more unique text strings in the column, a blank class is created.
Method
The Method list specifies the method used to calculate the limits of each class:
- Equal Number assigns the class ranges such that approximately an equal number of points are included in each class. In this case, the interval of each class is usually different.
- Equal Intervals assigns the class ranges so the interval between the >=Minimum value and the <Maximum value is equal for each class. In this case, different numbers of points are usually assigned to each class.
- Custom allows you to set the >=Minimum value and the <Maximum value for each class. This allows you to specify your own ranges for the classes. Ranges defined in this way do not have to be contiguous. To change the >=Minimum or <Maximum value for any class, double-click the value in the class list. In the Properties dialog, set the values and the symbol property. Click OK to return to the Edit Classes dialog.
- Name sets the method to use a text string. Each unique text string in the Class column is a separate Class Name. When the Method is set to Name, there is a Class Name option. Double-click on any text in the Class Name column to edit the class properties in the Properties dialog (see the Properties for a Particular Class section below). Unique text identifiers are not case sensitive. So, One, one, and ONE are all in the same group. Numbers are treated as text when the Method is set to Name.
Reset Names
If the selected Method is Names, click the Reset Names box to restore the class set to their original names and number of classes.
Add and Delete Classes
To delete a class, select the class to delete and then click the Delete Class button. When a class is deleted, the Method changes to Custom to show changes have been made to the default distribution. To reset the classes back to their default distribute, change Method to one of the other options.
To add a class, select the class nearest to the values of the new class you want to add and click the Add Class button. The new class will be added below the selected class and will initially have similar values. Double click the new class row and edit the values as needed. When a class is added, the Method changes to Custom to show changes have been made to the default distribution.
Class List Box
The class list box displays summary statistics and information:
- The >=Minimum column specifies the lower limit for each class of data. The minimum value is included in this class.
- The <Maximum column specifies the upper limit for each class of data. The maximum value is not included in the class.
- The Class Name column specifies the individual text entries for each class of data. All text with the same text string are included in the class. Unique text identifiers are not case sensitive. So, One, one, and ONE are all in the same group.
- The % column indicates the percentage of data points in the particular class. This value cannot be edited and is for informational purposes only.
- The # column indicates the number of points included in each class. This value cannot be edited and is for informational purposes only.
- The Symbol column displays the symbol used for each class.
- The Size column displays the size of the symbol used for each class.
Properties for All Classes
Properties can be defined for the size, symbol, and color of all classes. If properties for individual classes were already defined, those definitions will be overwritten by changes made to all classes.
Symbol Sizes
Click the Symbol sizes button to open the Symbol Sizes dialog. The Symbol Sizes dialog allows the size of all classes to be changed at the same time or allows for an incremental size to be set.
Classes Symbol
Click the Classes symbol button to open the Properties dialog. Set the Symbol, Symbol set, Fill, and Line properties for the symbol for all classes. Click OK and all classes update to show the selected symbol. This is useful if the same symbol should be used, but a variable color or size should be used for all classes.
Apply Gradient
The Apply Gradient button and list applies a color gradient to the class symbol line and/or fill colors.
From the list next to the Apply Gradient... button, select which properties are being colored:
- to line and fill sets both the line and fill color for each symbol as determined by the gradient.
- to line sets only the line color by the gradient. The fill color is set by the class color.
- to fill sets only the fill color by the gradient. The line color is set by the class color.
Click Apply Gradient
to select the gradient in the Color
Gradient dialog. Click the current selection next to Gradient
to select a predefined gradient. Click the  button to
create a custom gradient. The Gradient
is applied across all of the classes. The first class uses the minimum
color in the gradient. The last class uses the last color in the gradient.
All other classes are selected based on an equal number of intervals across
the gradient.
button to
create a custom gradient. The Gradient
is applied across all of the classes. The first class uses the minimum
color in the gradient. The last class uses the last color in the gradient.
All other classes are selected based on an equal number of intervals across
the gradient.
To set the class color to something other than a gradient, double-click on the symbol in the Symbol column and change the color in the Properties dialog.
Properties for a Particular Class
When Method is set to Name, a particular class can have its own class definition. To change the properties for a particular class, click the Properties button or double-click the class row and change class definition in the Properties dialog for the selected class. Classes can be reordered by dragging a class to a different position or by using the Up and Dn buttons to reposition the class. After saving changes in the Edit Classes dialog, the legend in the scatter plot will also reflect the new class order.
|
|
|
Example Edit Classes dialog and Properties dialog (for individual class definition) |

Saving or Loading Class Definitions
The Edit Classes dialog has options to apply changes, save changes, or load a previously saved class definition file.
Click the Apply button to apply changes and keep the Edit Classes dialog open or click OK to apply changes and close the Edit Classes dialog. If you want to save the changed class definitions for this plot or for use in other plots, to click the Save button and use the Save As dialog to save the definitions to a .GCL file. Click the Load button to open an existing classes .GCL file.