Labels Page - Box Plots
Data point labels can be shown on most plot types in Grapher. For a box plot, the labels can show the number of samples, the first quartile value, the third quartile value, the median value, the top and bottom whisker value, the minimum and maximum values, any outlier values, and the notch values. Labels can also be customized to appear in specific locations and can use a variety of formats, fonts, and colors to optimize the look of the graph.
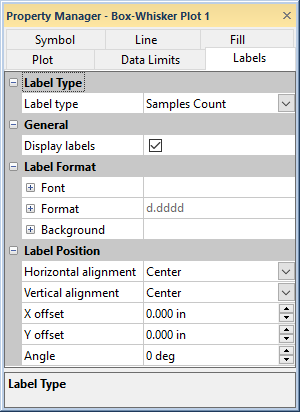
The following information is for the options contained on the box-whisker plot Labels tab. To edit the labels, click on a box plot to select it. In the Property Manager, click on the Labels tab.
|
|
|
Set label properties in the Property Manager on the Labels tab. |
Label Types
For a box plot, the labels can show the number of samples, the first quartile value, the third quartile value, the median value, the top and bottom whisker value, the minimum and maximum values, any outlier values, and notch values.
The Label type property determines which labels are currently being edited by the Property Manager. Select the label you wish to display in the Label type field, then select the Display labels option to show that label type on the plot.
The Samples Count displays the number of points used to calculate each box set. This is the number of points in the sample column. The Samples Count is displayed at the center of the box, by default.
The Quartiles (25) displays the first quartile value. The first quartile value is calculated by Grapher using the equation
Value[(0.25*(number of data points) + 0.5, rounded off to nearest whole number].
The first quartile value is displayed above the bottom of the box, by default.
The Median (50) displays the median value. The median value is calculated by Grapher using the equation
For an odd number of data points, this is the middle value. For an even number points, it is the mean of the middle values.
The median value is displayed above the median line, by default.
The Quartiles (75) displays the third quartile value. The third quartile value is calculated by Grapher using the equation
Value[0.75*(number of data points) + 0.5, rounded off to nearest whole number]
The third quartile value is displayed below the top of the box, by default.
The Whisker (lower) displays the label for the lower whisker value. The Whisker (upper) displays the label for the upper whisker value. The whisker value is determined based on the Whisker setting on the Plot page.
The Minimum and Maximum display labels next to the smallest and largest data points in the box-whisker plot. When outliers are displayed as symbols, the label for the Minimum value will be below the outlier symbol. The label for the Maximum value will be above the outlier symbol.
The Outliers labels displays a label next to each outlier when outliers are displayed as symbols. The label for the Outliers display to the right of the outlier symbol.
The Notches labels displays a label to the right of the median line with a +/- value, where the value is the distance from the median to the notch.
All labels can be moved with the Graph Tools | Plot Tools | Move Labels command.
Display Labels
Each label type can be individually set whether to be displayed or not. Select the desired label type in the Label type field, such as Samples Count. Then, check the box next to the Display option to add the specific label to the plot. To display multiple types of labels, open each label section and check the box next to the Display option.
Label Format
The Label Format section includes the Font, Format, and Background properties for the plot labels.
Label Font
Click the ![]() next to Font to set the label
font properties. The font
Face, Size (points), Color, Opacity,
Bold, Italic, Underline, and Strikethrough properties can be set for most labels.
next to Font to set the label
font properties. The font
Face, Size (points), Color, Opacity,
Bold, Italic, Underline, and Strikethrough properties can be set for most labels.
Label Format
Click the ![]() next to Format to set the label format properties. The label
Type, display of numbers, Prefix, and
Suffix can be set for labels.
next to Format to set the label format properties. The label
Type, display of numbers, Prefix, and
Suffix can be set for labels.
Label Background
Click the ![]() next to Background to set the
label background properties. The Background
is the area behind the label. Click the
next to Background to set the
label background properties. The Background
is the area behind the label. Click the  next to Line
to set the line properties for the line that goes around the text.
Click the next
to Fill to set the fill properties
for the area around the text.
next to Line
to set the line properties for the line that goes around the text.
Click the next
to Fill to set the fill properties
for the area around the text.
Label Position
The Label Position section includes properties for defining the label position and rotation.
Horizontal Alignment
The plot label can be positioned relative to the data point vertically, horizontally, and by specified amounts. Horizontal alignment controls the horizontal placement of the labels. You can position the labels to the Left or Right of the data point, Center the labels on the data point, or alternate the position of the labels to the left and right of neighboring data points (Alternate left-right). To change the horizontal placement of the labels, click the existing option and select the desired option from the list.
Vertical Alignment
Vertical alignment controls the vertical position of the data label. You can position the labels Above or Below the data point, Center the labels on the data point, or alternate the position of the labels above and below neighboring data points (Alternate above-below). To change the vertical placement of the labels, click the existing option and select the desired option from the list.
Label Offset
Labels can be positioned at a custom position by entering values into the X offset or Y offset boxes. Entering a positive value into the offset box moves the label up for the Y offset or to the right for the X offset. Entering a negative value in the offset box moves the label down for the Y offset or to the left for the X offset.
Angle
You can enter a number into the Angle box to rotate the data point labels. Positive values rotate the label in a counter-clockwise direction. The Angle is specified in degrees.
Label Leader Line
Label leader lines can be used to connect the text label to the data point. If the edge of the label is further than 0.1 inches (0.254 centimeters) away from the data point, label lines are displayed. This normally means that label lines are displayed if labels have been moved with the Move Labels command or if the X offset or Y offset values have been changed from zero. The line goes from the label to the point. Line properties can be changed for the label lines. To change the label line properties, change the properties in the Label Leader Line Properties section of the Line page.