Plot Page - Box Plots
To view and edit box plot properties, select the box plot and then click the Plot tab in the Property Manager. You can then change the axes, change the data file, and set data used in the box plot.
Click one of the Plot page section names in the list below to read more information about the properties in those sections or follow this help topic sequentially to read about each property.
|
|
|
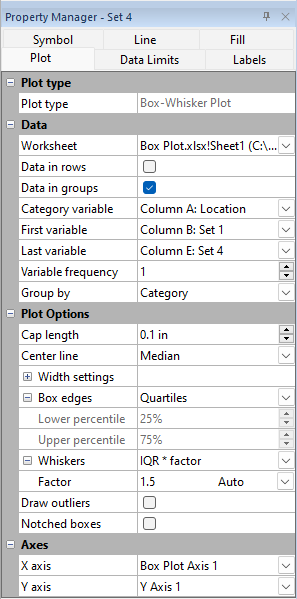
Set box-whisker plot properties in the Property Manager on the Plot tab. |
Plot Type
The Plot type property displays the type of plot.
Data
Worksheet
Click the existing data path next to Worksheet to open a list containing a list of all open worksheets plus a Browse command. Choose one of the listed data files or click the Browse command to launch the Open Worksheet dialog and navigate to another data file.
To change multiple plots' worksheets simultaneously, first select all plots in the Object Manager, then change the Worksheet property in the Property Manager.
NOTE: The worksheet columns are retained after changing the worksheet. If any of the column options are blank after changing the Worksheet, click on the blank option and select the desired column. A blank next to column means that the column does not exist in the new worksheet.
Data in rows
Select the Data in rows option if your data file is formatted where each row includes one variable. When the Data in rows option is selected, all plot properties that require data values are specified by selecting a data row. This includes variables such as X and Y, data labels, worksheet ranges, etc. Properties that list column letters will update to list row numbers. When switching from plotting data in columns to plotting data in rows, Grapher may not be able to select the correct rows automatically. Verify the correct rows are selected.
The property descriptions below refer to data columns, but when Data in rows is selected the property lists will include rows.
Data in groups
Select the Data in groups option if your data file is formatted such that the data can be separated into both variables and categories. When the Data in groups option is selected, the Category variable is used to define a secondary grouping for each column or row of data.
For example, let's say you collected Carbon Dioxide, Oxygen, and Nitrogen readings every hour over several days. You may have the date of each reading in Column A, the time in Column B, and the CO2, O2, and N2 readings in Columns C, D, and E respectively. In this example the date of the reading would be considered the category and the readings would be the variables in a grouped box plot.
Variables
Select the data to use in the box plot in the Category variable, First variable and Last variable fields. Click the down arrows to view all columns available to use in the box plot. If the first worksheet row contains header information, the header information appears next to the column letter. The box plot data need to be arranged in columns or rows for each variable. In the First variable list, select the first data column that you want to plot. In the Last variable list, select the final column that you want to plot. By default, all data columns between the First variable and Last variable are included in the plot.
Use the Variable frequency option to skip columns of data in the plot. For example, if Variable frequency is set to 2, every other column is plotted on the graph. When the Variable frequency is greater than 1, the first column displayed is the First column. The next column to display is the First column + the Column frequency. For instance, if the First column is Column E, the Last column is Column AE and the Column frequency is 8, the columns E, M, U, and AC are displayed in the box plot.
Group By
Select Category to group the boxes in the plot based on the values in the category column or row. This will result in one box for each variable grouped above a single category label.
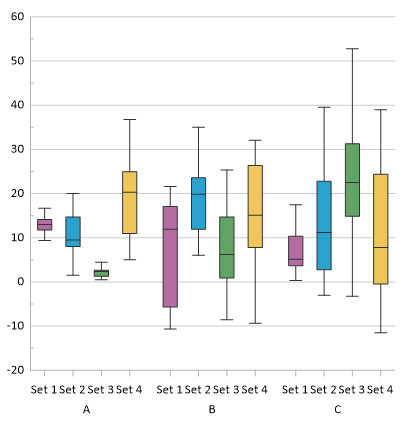
The box plot above shows boxes for four variables
grouped into three categories
Select Variable to group the boxes in the plot based on the variable columns or rows. This will result in one box for each category grouped above a single variable label.
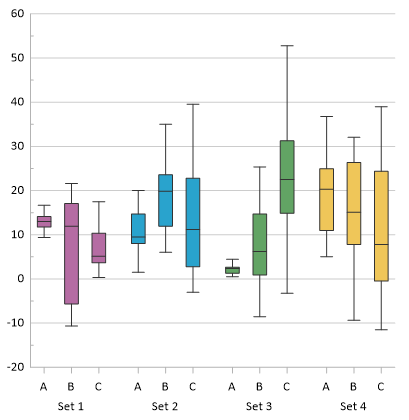
The box plot above shows boxes for three categories
grouped above four variable names
Plot Options
Cap Length
The Cap length adjusts the length of the cap lines (whiskers) on either end of the lines. To display the box plot without the whiskers, set the value for the Cap length to zero.
Center Line
The Center line property sets which statistical value is represented by the line in the box. Select Median or Mean in the Center line list.
Width Settings
Width settings determine the size of the boxes. When Grapher creates a plot, the box widths are auto-sized to be the same width and have the same amount of distance between them. Use the Box width (percentage) property to adjust the width of all boxes using a percent value. This property affects the box size for each width Type.
The Type property has three options to set the width of the boxes.
- Auto sets the box widths to be the same width and have the same amount of distance between them.
- Variable sets the boxes to a relative width determined by the sum of the samples counts of all boxes.
- Fixed sets the boxes to the width entered into the Fixed width property.
Box Edges
The box extents are determined by the Box edges property. Select the desired statistical value for the box extents in the Box edges list:
- Quartiles sets the box extents to the first and third quartiles, i.e. the 25th and 75th percentiles.
- Percentiles enables the Lower percentile and Upper percentile properties. Specify the percentile you wish to indicate with the box edge in either the Lower percentile or Upper percentile field and the other property will automatically update.
- Confidence level sets the box extents to the confidence interval. Specify the confidence level in the Level property. The Level can be between 50% and 99%.
- Standard deviation sets the box extents at one or more standard deviations from the mean. Specify the number of deviations in the # deviations from mean property field.
- Standard error sets the box extents at one or more standard errors from the mean. Specify the number of errors in the # of errors from mean property field.
- Minimum/maximum sets the box extents at the data minimum and maximum.
- Average sets the box extents at the average value of all data points above the mean and all data points below the mean.
Whiskers
The Whiskers controls where the cap lines (whiskers) are drawn. Available options are:
- IQR*factor calculates the whiskers based on the interquartile range. The Factor value determines how far the whiskers extend beyond the box based on the inter-quartile range. Using an IQR factor extends the sensitivity scale of the IQR calculation that defines what data points are considered outliers. A factor of 1.5 places the whiskers such that data points lying outside of the upper and lower inner fences (Q1 ± (1.5 * IQR)) are considered outliers, and a factor of 3 places the whiskers such that data points lying outside of the upper and lower outer fences (Q3 ± (3 * IQR)) are considered outliers.
- Minimum/Maximum places the whiskers at the absolute smallest and largest values in the data.
- Percentile places the whiskers at the specified percentage of the data. Specify the percentile range in the Lower percentile or Upper percentile property field.
- Standard deviation places the whiskers at one or more standard deviations from the mean. Specify the number of deviations in the # deviations from mean property field.
- Standard error places the whiskers at one or more standard errors from the mean. Specify the number of errors in the # errors from mean property field.
Draw Outliers
When the Draw outliers box is checked, a symbol is placed at the outlying points and the whisker value is recalculated, if necessary.
|
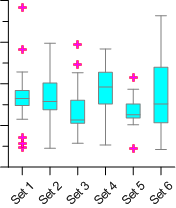
| You can display outlier symbols on box whisker plots. |
An outlier is any point that falls outside the whiskers. When the Whiskers option is set to IQR*factor, this is any value below QL – Factor*IQR or above QU + Factor*IQR. Where:
- IQR is the interquartile range, the difference between the first and third quartiles.
- QL is the value of the lower quartile (bottom of the box).
- QU is the value of the upper quartile (top of the box).
- The default Factor value (1.5) can be changed.
If the Draw outliers box is not checked, some points may not be displayed in the box-whisker plot, depending on the Whiskers option.
Outlier Symbol
Click the Symbol page to edit the outlier symbol size, fill or line properties.
Notched Boxes
Check the box next to Notched boxes to display indented notches at the Notch factor. The notches surrounding the median value provides a measure of the rough significance of differences between the median values. When the Notch factor is set to the default value of 1.7, the notches display approximately the 95% confidence level in the median. If the notches about two medians overlap, the medians of the two boxes are considered the same within the confidence level. When the notches do not overlap, the medians are considered significantly different. When the notch is outside the box (larger than the difference between the first quartile and the median or the third quartile and the median), the box is displayed as inverted. This indicates a low level of confidence in the median.
Notch Factor
The Notch factor is the value multiplied by the standard deviation of the median. The default Notch factor of 1.7 approximately shows 95% confidence in the median. To increase the degree of confidence in the median values, increase the Notch factor. For most cases, a value of 1.96 would show approximately 99% confidence in the medians. A smaller value would result in a more conservative a test of the confidence. Appropriate values range between approximately 1.3 and 1.96. The value must be greater than zero. To change the Notch factor, select Custom from the list, type a new value, and press ENTER on the keyboard to make the change. To return the Notch factor to the default value, click the word .
Axes
Click the Y axis field to change the Y axis used for a vertical box plot. Click the X axis field to change the X axis used for a horizontal box plot. Choose Select plots/axis to change the axis used by several plots on a graph. The X axis cannot be changed for a vertical box plot, and the Y axis cannot be changed for a horizontal box plot.
Example
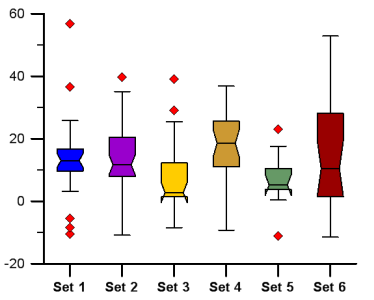
In the example below, the Whiskers are set to IQR*factor, where the factor is 1.5. The notches are displayed at the Notch factor of 1.7, displaying 95% confidence in the medians. The blue, purple, and red bars sets have overlapping notches. This indicates that these three sets have the same median value, with 95% confidence. The yellow, gold, and green boxes do not overlap the blue, purple and red bars indicating that these sets have different median values within the confidence. The yellow and green boxes have inverted notches, indicating that additional observations are required to have better confidence in the calculated median value.
|
|
The notched box-whisker plots add additional levels of confidence to the calculated median values. |
References
Robert McGill; John W. Tukey; Wayne A. Larsen, Variations of Box Plots, The American Statistician, Vol. 32, No. 1 (February 1978), pp. 12-16.