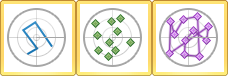
Polar Line Plot, Polar Scatter Plot, Polar Line/Scatter Plot

|
| Polar plots can have degree, radian, or grad units. This polar plot has labels to show degrees. |
Creating a New Polar Graph
To create a polar graph:
- Click the Home | New Graph | Polar | Polar Line Plot, Home | New Graph | Polar | Polar Scatter Plot, or Home | New Graph | Polar | Polar Line/Scatter Plot command.
- Select a data file in the Open Worksheet dialog. You can select a new data file or you can select an open data file in the Open worksheets section.
- Click the Open button. A polar line, scatter, or line/scatter plot is created using the default properties.
Editing Polar Plot Properties
To change the features of a polar plot, including the columns used to create the graph, first select the plot in the plot window or Object Manager and then edit its properties in the Property Manager.
Click the following tabs in the Property Manager to change different properties: