Class Scatter Plots
|
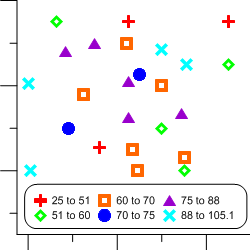
Click the Home | New Graph | Class/Bubble | Class Scatter Plot command to create a class scatter plot. A class scatter plot is a scatter plot with symbols for each XY location based on a required third value (Class column). Class scatter plots group data into discrete classes (bins). The data points are displayed using the symbol assigned to the class. Class scatter plots include a legend by default. Click the Class Scatter Plot button to create a class plot. |
|

|
|
|
The location of each of the class plot's XY data points is based on the Class value. |
Creating a New Class Scatter Plot
To create a class scatter plot:
- Click the Home | New Graph | Class/Bubble | Class Scatter Plot command.
- Select a data file in the Open Worksheet dialog. You can select a new data file or you can select an open data file in the Open worksheets section.
- Click the Open button. A class scatter plot is created using the default properties.
Editing Class Scatter Plot Properties
To change the features of a class scatter plot, including the column used to control the class, first select the class scatter plot in the plot window or Object Manager and then edit its properties in the Property Manager.
Click the following tabs in the Property Manager to change different properties: