Tick Marks
Set major and minor tick mark spacing, tick length, and tick range in the axis properties Ticks page. The selected axis properties appear in the Property Manager. There are two types of tick marks, major and minor. Minor tick marks subdivide the region between the major tick marks.
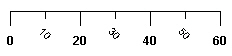
This example axis shows major tick
marks in bold and minor tick marks
on a 45 degree angle.
|
|
|
Set the tick mark spacing options on the Ticks tab in the Property Manager. |
Axes
For a graph magnifier, the Axes option sets the axis for which the tick marks are being set. To change the axis, click on the current axis name and select the desired axis from the list. Note, if the options on this tab are not available, the Axes on edge option is checked on the Magnifier tab. To change the tick mark position settings, click on the Magnifier tab and clear the Axes on edge option first.
Show Ticks
Ticks can be shown on either side of an axis line. When editing an X Axis or Z Axis, you have the option to Show ticks on top or Show ticks on bottom of the axis. You can check both of these boxes to place tick marks on both sides of the axis. When editing a Y Axis, these options change to Show ticks on right and Show ticks on left. Tick marks can be located on both sides of the axis at the same time by checking the boxes next to both options.
When editing an angle axis, the options are Show ticks on inside or Show ticks on outside of the angle axis.
Major Tick Mark Spacing
Grapher automatically generates the major tick spacing if Auto is selected for the Spacing. The Spacing is in the axis units. A maximum of 1000 tick marks can be displayed on any axis, so the Spacing will automatically change to prevent additional tick marks over the limit from being created. The custom spacing option is available for standard linear-scale axes and angle axes. If the Spacing option is not available, change the Scale on the Axis page or set the Label source to Automatic on the Labels page.
If Auto is selected for the Spacing, Grapher sets a reasonable number of tick marks between the minimum and maximum values on the axis. To change the Spacing, highlight the current value and type a new value. Press ENTER on the keyboard to make the change. To return to the default values, click the word Custom and select Auto. Spacing will revert to the default value.
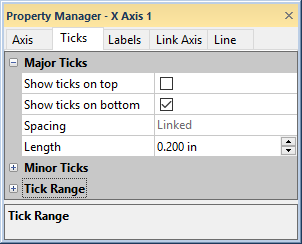
When Link tick spacing option is selected on the Link Axis tab for a dependent axis, the Spacing option on the Ticks tab displays Linked in the Property Manager. To change the Spacing for the dependent axis, select the controlling axis and change the Spacing.
|
|
When the Link tick spacing box is checked on the Link Axis tab, the axis shows Linked next to Spacing on the Tick Marks tab. Tick mark spacing changes must be made to the controlling axis. |
Date/Time Major and Minor Tick Mark Spacing
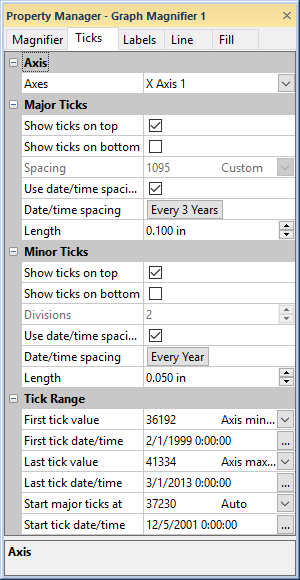
If you have enabled date/time formatting, you can set the major and minor tick marks to be spaced at specific date/time intervals. To turn on major date/time spacing, check the box next to the Use date/time spacing option in the Major Ticks section. To turn on minor date/time spacing, check the box next to the Use date/time spacing option in the Minor Ticks section.
To set the date/time interval between ticks, click the current spacing next to Date/time spacing. In the Date/Time Spacing dialog, set the interval. Set the first box to the desired value and the second box to the desired time period. Setting the Date/Time spacing to 1 Year creates a tick mark every year. Setting this to 6 Month creates one tick mark every six months.
Major and minor tick marks can have different date/time spacings. For example, major tick marks can be set to display a tick mark and label every year. Minor tick marks can be set to display a tick mark and label every 3 months.
Minor Tick Mark Divisions
Set the number of divisions between major ticks by entering a number into the Divisions box in the Minor Ticks section. The Divisions option is available for linear, base 10, natural log, and angle axes. For example, a Divisions value of 10 for a linear scale creates nine tick marks and ten spaces between each major tick, and a value of 90 for a log base 10 scale creates nine tick marks and ten spaces between each major tick.
Length
The length of the major and minor tick marks is set in the Length field. The Length is set in page units and can be any value between 0 and 6 inches (0 and 15.24 centimeters).
Tick Range
The Tick Range section controls the tick starting and ending positions along a given axis range for standard axes.
First Tick and Last Tick
The First tick value and Last tick value can be set to the Axis minimum, Axis maximum, Data minimum, Data maximum, or you can select Custom starting and ending tick values. To change the First tick value or Last tick value, click on the current option. Select the desired option from the list.
The axis minimum and maximum limits are set on the Axis tab in the Limits section. When the First tick value and Last tick value are set to Axis minimum and Axis maximum, Grapher automatically updates the ticks when the axis limits change.
Data minimum or Data maximum places the first tick mark at the closest tick to the minimum data point, and the last tick at the closest to the maximum data point. The spacing of the major tick marks determine how far the first tick is away from the first data point. For example, if the tick mark spacing is set to five, the data minimum is three, and the First tick value is set to the Data minimum, the first tick is five.
Select Custom to enter specific starting or ending ticks in the First tick value and Last tick value boxes. The custom value must be within the range of the axis minimum and axis maximum. To use a larger or smaller number, first set the axis minimum and maximum on the Axis tab in the Limits section.
By default, most axes set the First tick value to Axis minimum and Last tick value to Axis maximum. However, an XYZ graph X axis sets the Last tick value to Data maximum by default. This makes it less likely the last X axis tick label and first Z axis tick label will intersect. However, the labels may still intersect with certain data sets.
Start Major Ticks At
To start the tick marks at a specific value, highlight the current Start major ticks at value and type a new value in the Start major ticks at field. For example, if the axis minimum is two and the tick spacing is two, the first tick is two if the Axis minimum option is selected. If 3 is entered into the Start major tick at box, the first tick is three, the next major tick is five, and so on.
Date/Time Tick Mark Range
If you have enabled date/time
formatting, you can set the tick mark range to begin and end at a
specific date and time. To set the starting date/time, click the  next to the date next to First
tick date/time. In the Select
Date/Time dialog, set the starting date and time. Click OK.
Dates can also be edited directly in the Property
Manager by highlighting the existing value and typing a new value.
Press ENTER on the keyboard to make the change. When inputting date/time
values directly in the Property Manager,
date/times must always be entered in the MM/dd/yyyy
hh:mm:ss format. No other formats are permitted in the date/time
edit boxes in the Property Manager.
next to the date next to First
tick date/time. In the Select
Date/Time dialog, set the starting date and time. Click OK.
Dates can also be edited directly in the Property
Manager by highlighting the existing value and typing a new value.
Press ENTER on the keyboard to make the change. When inputting date/time
values directly in the Property Manager,
date/times must always be entered in the MM/dd/yyyy
hh:mm:ss format. No other formats are permitted in the date/time
edit boxes in the Property Manager.
To set the last date/time tick mark, click the
next to the date next to Last tick date/time.
In the Select Date/Time dialog,
set the ending date and time. Click OK.
Tick marks are positioned between the First
tick date/time and Last tick
date/time based on the Spacing
in the Major Ticks section. Dates
can also be edited directly in the Property
Manager by highlighting the existing value and typing a new value.
Press ENTER on the keyboard to make the change.
Ternary and Piper Diagram Tick Mark Direction
Ternary diagrams and Piper diagrams have a Tick direction option. Select Perpendicular to draw the tick marks perpendicular to the axis. Select Angled to draw the tick marks as an extension of the ternary grid lines from all axes. The Angled option creates v-shaped tick marks. Select Grid line direction to draw tick marks parallel to the axis grid lines. The Grid line direction option makes ternary and piper diagrams easier to read.