Magnifier Page
The Magnifier page controls the box selection and the axes displayed in the Zoomed area box.
|
|
|
The Magnifier tab in the Property Manager controls the graph magnifier axis settings. |
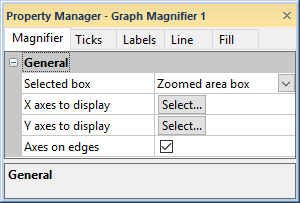
Selected Box
The Selected box section controls which box of the magnifier is selected. To change the Selected box, click on the current option and select the desired option from the list. Select Area selection box or Zoomed area box from the Selected box list to select what box is currently selected. The selected box will be seen in the plot window with six green selection handles around the entire box. Change the Selected box to move either box around in the plot window.
Another method to switch which box is selected is to right-click on the magnifier and choose Switch box.
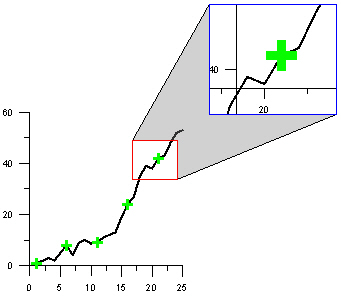
This example shows the Area selection
box in red
and the Zoomed area box in blue.
X Axes to Display
Click the Select button to open the Select Axes dialog. In the dialog, select the box next to any of the axes to display the axis in the Zoomed area box. A check mark indicates the axis will be displayed in the Zoomed area box. Click OK to close the dialog and return to the Property Manager.
Y Axes to Display
Click the Select button to open the Select Axes dialog. In the dialog, select the box next to any of the axes to display the axis in the Zoomed area box. A check mark indicates the axis will be displayed in the Zoomed area box. Click OK to close the dialog and return to the Property Manager.

This example shows only the X axis being
displayed in the Zoomed area box.
Axes to Display for Ternary Plots
The magnifier properties for a Ternary plot includes only a single Axes property. Click the Select button to open the Select Axes dialog. In the dialog, select the box next to any of the axes to display the axis in the Zoomed area box. A check mark indicates the axis will be displayed in the Zoomed area box. Click OK to close the dialog.
Axes on Edges
The Axes on edges option forces the axes to the edge of the Zoomed area box. The axis is forced to the edge of the Area selection box nearest the axis. For example, an X axis at the top of the graph will be forced to the top edge of the Zoomed area box, while an X axis at the bottom of the graph will be forced to the bottom of the Zoomed area box.
The Axes on edges option limits the location of tick marks and tick labels. When Axes on edges is selected, tick marks and labels must be plotted inside the axes in the Zoomed area box. Clear the Axes on edges option to enable the Show ticks on top/right and Show ticks on bottom/left options on the Tick Marks page and the Labels on side option on the Tick Labels page.
The Axes on edges property is not available for Ternary plots.