Link Axis
The Link Axis tab in the Property Manager controls how multiple axes are linked together. Linking can control the scaling, tick position, tick mark spacing, limits, and length of the axis. When the controlling axis is edited, all linked axes are also updated.
To link axes, at least two axes must exist in the graph. This can be an X and Y axis or it can be multiple X, Y, or Z axes. Open or create a graph and select the axis to be linked to another axis. With this dependent axis selected, click on the Link Axis tab in the Property Manager.
|
Link Axis
The Link axis option sets the controlling axis. This is the controlling axis that controls the selected dependent axis. Set the controlling axis by selecting the desired controlling axis from the Link axis list. Only axes from the current graph can be selected.
Link Axis Scale
Checking the Link axis scale box means that when the Scale option in the Axis Properties section on the Axis tab changes for the controlling axis, the dependent axis also changes. For example, if the Scale for the controlling axis is changed from Linear to Log (base 10), the Scale for all dependent axes are automatically updated. To link the axis scale, check the box next to Link axis scale when the dependent axis is selected.
When Link axis scale is checked for a dependent axis, the Scale option on the Axis tab displays Linked in the Property Manager. To change the Scale for the dependent axis, select the controlling axis and change the Scale.
Link Tick Spacing
Checking the Link tick spacing box means that when the Spacing option in the Major Ticks section on the Tick Marks tab changes for the controlling axis, the dependent axis also changes. This can mean that the major tick mark spacing is set for all axes at once. This does not control tick mark length, tick mark line properties, or the number of divisions for minor tick marks. For example, if the controlling axis Spacing is changed to 5, all dependent axes are automatically updated to a major tick mark Spacing of 5. To link the axis tick mark spacing, check the box next to Link tick spacing when the dependent axis is selected.
When Link tick spacing is checked for a dependent axis, the Spacing option on the Ticks tab displays Linked in the Property Manager. To change the Spacing for the dependent axis, select the controlling axis and change the Spacing.
When Link tick spacing is checked, the Link tick position check box cannot be selected.
Link Limits
Checking the Link limits box means that when the Minimum or Maximum option in the Limits section on the Axis tab changes for the controlling axis, the dependent axis also changes. This means that the starting and ending values are automatically calculated based on the controlling axis. When plot data changes or the controlling axis Minimum or Maximum changes, all dependent axes also change. For example, if the controlling axis Minimum value is changed to 15, all dependent axes are automatically updated to a Minimum value of 15. To link the axis limits, check the box next to Link limits when the dependent axis is selected.
When Link limits is checked for a dependent axis, the Minimum and Maximum options in the Limits section on the Axis tab displays Linked in the Property Manager. To change the Minimum or Maximum for the dependent axis, select the controlling axis and change the Minimum or Maximum.
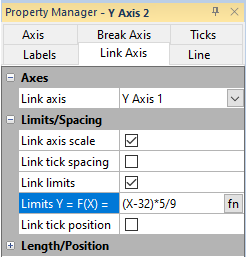
Limits Equation
When the Link limits box is
checked, the Limits Y = F(X) =
option becomes available. This option allows an equation to be input for
the linked axis. For instance, if the controlling Y
Axis displays degrees Fahrenheit and the dependent axis should display
degrees Celsius, the equation to enter is (X-32)*5/9. The X refers to
the controlling axis. The equation is always input so that the dependent
axis scale is calculated using the controlling axis. Click the  button to select from a
variety of functions, if needed.
button to select from a
variety of functions, if needed.
The dependent axis can have an inverse relationship to the controlling axis, for example functions of the form 1/X, which may be used plotting reciprocal scale relationships. Example equations are: Y=1/X, Y=10-X, Y=1/X^2. For all equations, Grapher validates that the start and end of the limits are correct output values of the limit equation. The axis tick position values are linear interpolations of the limits, and for non-linear equations, Grapher cannot validate that the equation will not cause loops or be invalid.
See Mathematical Functions for information on writing function equations.
|
|
|
This example displays a degrees Celsius axis linked to a degrees Fahrenheit axis. |
Link Tick Position
When the Link tick position box is checked, the tick positions of the dependent axis will align with the tick positions of the controlling axis.
When the Link tick position box is checked, neither the controlling nor the dependent axes can have an axis break applied, and the Scale property in the Geometry section of the Axis property page must be Linear.
After the Link tick position box is checked, Grapher automatically:
-
Disables the Link Axis Link tick spacing property
-
Enables Link Axis Link length property
-
Changes the Link Axis Length scale property to 1
-
Disables the Ticks Spacing property
-
Disables the Ticks Divisions property
-
Disables the entire Ticks Ticks Range section
make sure to say add to break that acis can be linked
Link Length
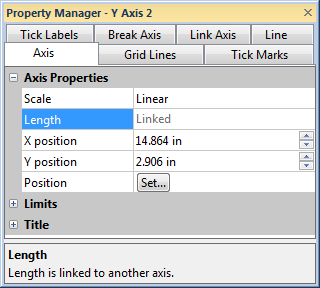
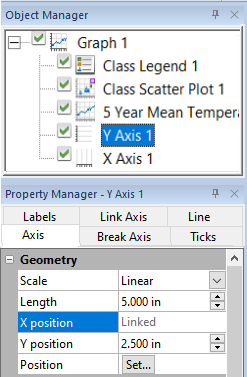
Checking the Link length box means that when the Length option in the Axis Properties section on the Axis tab changes for the controlling axis, the linked axis also changes length. This means that the length of the axis is set by the controlling axis. For example, if the controlling axis is changed to 2 inches long, all linked axes also automatically change to 2 inches long. To link the axis length, check the box next to Link length when the dependent axis is selected.
When Link length is checked for a dependent axis, the Length option in the Axis Properties section on the Axis tab displays Linked in the Property Manager. To change the Length for the dependent axis, select the controlling axis and change the Length.
|
|
|
When the Link length box is checked, the axis shows Linked next to Length on the Axis tab. Length changes must be made to the controlling axis. |
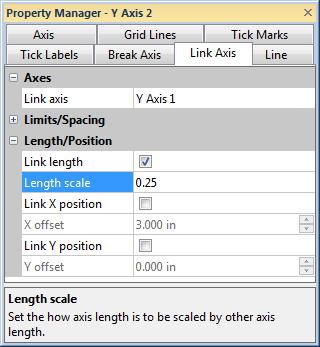
Length Scale
When the Link length box is checked, the Length scale option becomes available. This option allows a multiplying scaling value to be input for the linked axis, if desired. By default, the Length scale is set to 1. This means that the linked axis is exactly the same length as the controlling axis. To change the value, highlight the existing 1 and type the desired value. To make the linked axis twice as long as the controlling axis, set the Length scale to 2. If the controlling axis is 2 inches long, the linked axis will be 4 inches long. To make the linked axis half as long as the controlling axis, set the Length scale to 0.5. If the controlling axis is 2 inches long, the linked axis will be 1 inch long.
To change the Length scale option, highlight the existing value and type a new value.
|
|
|
In this example, the linked axis will automatically be 1/4th the size of the controlling axis. If the controlling axis Length
is changed, the linked axis will |
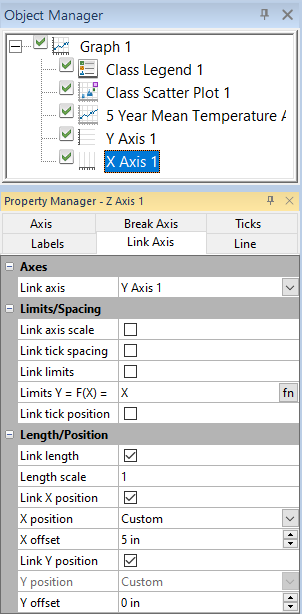
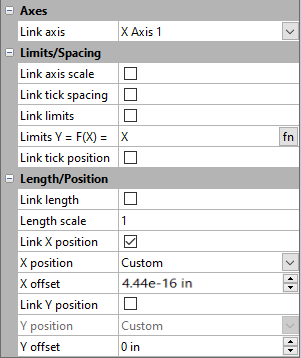
Link X Position
Check Link X position to coordinate the horizontal positioning between the controlling axis and the linked axis. Moving the controlling axis left or right on the page also moves the linked axis the same distance left or right on the page. For example, if the controlling axis is moved 2 inches to the left, all linked axes also automatically move 2 inches to the left.
When the dependent axis is selected, link it to the X position by checking Link X position .
When Link X position is checked, the X position option in the Axis Properties section on the Axis page displays as Linked.
|
|
|
|
When the Link X position box is checked, on the Axis page the axis shows Linked next to X position. Position changes must be made to the controlling axis. |
|
X Position
After selecting the Link X position property , the X position property is displayed. The X position property positions the linked axis relative to the controlling axis. The list includes Left of link axis, Right of link axis, Custom, and None. Which options are displayed in the X position list depends on the linked and controlling axis types.
X Offset
After checking the Link X position option AND if the X position is set to Custom, the X offset becomes available. Type a distance in page units in the X offset field to specify an X position offset between the linked and controlling axes. Positive values move the linked axis to the right and negative values move the linked axis to the left of the controlling axis. If the axes should be directly on top of each other, set the X offset to 0.
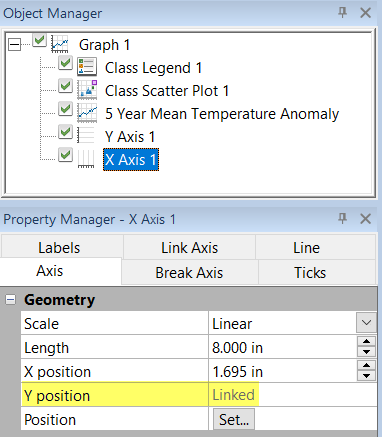
Link Y Position
Link Y position coordinates the vertical positioning between the controlling axis and the linked axis. For example, if the controlling axis is moved 2 inches up, all linked axes also automatically move 2 inches up.
Select the dependent axis and check Link Y position to link it to the controlling axis.
When Link Y position is checked, the Y position on the Axis Properties section on the Axis page displays as Linked.
|
|
|
|
When the Link Y position box is checked, the axis shows Linked next
to Y position on the Axis tab. |
|
Y Position
Check Link Y position and select an option from Y position to reposition the dependent axis relative to the controlling axis. The options are Top of link axis, Bottom of link axis, and Custom. Which options are displayed in the Y position list depends on the linked and controlling axis types.
Y Offset
Select Link Y position option AND if the Y position is set to Custom, Y offset becomes available. Type a distance in page units in the Y offset field to specify an offset between the linked and controlling axes. Positive values move the linked axis up from and negative values move the linked axis down from the controlling axis. If the axes should be directly on top of each other, set the Y offset to 0.
Link the Z Axis
Which X position and Y position values are available depend on which axis is the controlling axis and which axes are being linked.
Example - Duplicate Axis
One common graph presentation is a single plot with a repeated vertical axis. When the plot changes only one axis automatically updates because the plot's data is displayed only using one axis. With axis linking, now the other axis can also update automatically. By default, duplicate axes have linked scales, tick mark spacing, length, and limits.
To create a duplicate axis:
- Click on the controlling axis to select it.
- Click the Graph Tools | Add to Graph | Duplicate Axis command.
- In the Position Axis dialog,
- Set the location for the new axis. For instance, you can select At the right of.
- Set any other options, such as checking the Flip tick marks and labels.
- Click OK.
- The axis is added to the graph and automatically has the scale, tick mark spacing, length, and limits linked to the original axis.
|
|
|
The duplicate axis on the right side of the graph will automatically change when any properties of the Y axis on the left side of the graph change. |
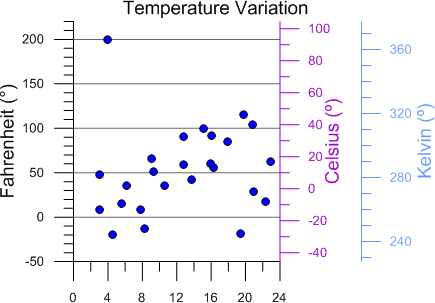
Example - Multiple Axes with Different Limits
Another common graph presentation is a single plot with multiple vertical axes with different limits. When the plot changes only one axis automatically updates because the plot's data is displayed only using one axis. With axis linking, now the other axis can also update automatically. The axis can be added with the Graph Tools | Add to Graph | Duplicate Axis command.
To create a linked axis with different limits:
- Click on the controlling axis to select it.
- Click the Graph Tools | Add to Graph | Duplicate Axis command.
- In the Position Axis dialog,
- Set the location for the new axis. For instance, you can select At the right of.
- Set any other options, such as checking the Flip tick marks and labels.
- Click OK.
- The axis is added to the graph and automatically has the scale, tick mark spacing, length, and limits linked to the original axis. Click on the axis to select it.
- In the Property Manager, click on the Link Axis tab.
- Highlight the X next to the Limits Y = F(X) = and type (X-32)*5/9 and press ENTER.
- The axis limits automatically update to be based on the controlling axis, but are calculated based on the input equation.
|
|
|
This example shows two dependent axes on the right side
of the graph. As the properties of the plot or the Fahrenheit
(°) axis on the left side of the graph change, |