Grid Lines
Grid lines are available on standard, angle, and stiff plot X axes. Grid line properties are edited on Line page in the Property Manager. On 3D axes, the grid lines appear at the front of the graph. Set default grid line properties through File | Defaults under the Grid Lines section of a respective axis type. The selected grid line properties then appear in the Property Manager.
|
|
|
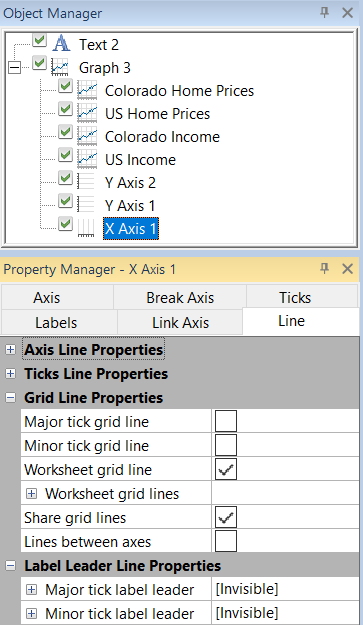
Display grid lines and alter grid line properties on the Line tab in the Property Manager. |
Axes
For a graph magnifier, the Axes option sets the axis for which the grid lines are being set. To change the axis, click on the current axis name and select the desired axis from the list.
Parallel Axis
The Parallel axis defines the grid line direction and length. Grid lines are drawn parallel to the axis selected in the Parallel axis field, and grid lines are drawn to the same length as the axis selected in the Parallel axis field. Select the axis in the drop-down to apply the grid line properties to that axis or select All parallel axes to apply the grid line properties to all parallel axes.
If a Y Axis is selected in the Object Manager, all the Y axes in the graph appear in the Parallel axis list. If an X Axis is selected in the Object Manager, all of the X axes in the graph appear in the Parallel axis list.
Display Grid Lines
Grid lines can be drawn at major ticks, minor ticks, and locations specified by worksheet values. Select the Major tick grid line option to display grid lines at major tick marks. Select the Minor tick grid line option to display grid lines at minor tick marks.
At Labels Only
In addition, grid lines can be displayed only at labeled tick marks. Check the boxes next to At major labels only or At minor labels only to display grid lines only when a label is displayed for a tick mark. At major ticks must be checked if you would like to select At major labels only. At minor ticks must be checked if you would like to select At minor labels only.
Step Value
Use the Step value to skip
grid lines. For example, if the step factor is set to three, every third
grid line is displayed. To change the value, highlight the existing number
and type a new number. Press ENTER on the keyboard to make the change.
Alternatively, click the ![]() next to Step valueto increase or
decrease the value.
next to Step valueto increase or
decrease the value.
Worksheet Grid Lines
Select the Worksheet grid lines option to display grid lines at values in a worksheet. The worksheet must contain a data column that contains the values where the grid lines should appear.
Worksheet
Specify the worksheet next to the Worksheet option. To select or change the worksheet, click the word None next to the Worksheet field to select the worksheet containing the grid line column. A list appears from which you can select an existing worksheet to open. Alternatively, you can choose the Browse option to open the Open Worksheet dialog and select a different worksheet file. Click the Open button to exit the Open Worksheet dialog.
Data in Rows
Select the Data in rows option if your data file is formatted where each row includes one variable. When the Data in rows option is selected, all plot properties that require data values are specified by selecting a data row. This includes variables such as X and Y, data labels, worksheet ranges, etc. Properties that list column letters will update to list row numbers. When switching from plotting data in columns to plotting data in rows, Grapher may not be able to select the correct rows automatically. Verify the correct rows are selected.
The property descriptions below refer to data columns, but when Data in rows is selected the property lists will include rows.
Column
The Column option lists all of the columns in the worksheet. Select the appropriate column that contains the grid line values. All values in the column are displayed as grid lines, so it is advised that a separate column be created for the grid line display. To select a column, click on the current option and select the desired column from the list.
Line Properties
The Major line properties, Minor line properties, and Worksheet line properties sections contain the line properties for the various grid lines.
Custom Grid Line Spacing Example
Grid lines can be added to specific locations on the axis through worksheet grid lines.
To add custom grid lines to the graph:
-
Type the data values of the grid lines into a column in a data file. For example, to place grid lines at axis values three, seven, and nine, enter 3, 7, and 9 into an empty data column. This data file does not need to be the same data file used to create the graph.
-
In the plot window or Object Manager, click on the axis to select it.
-
In the Property Manager, click on the Line tab.
-
Click the
 next to Grid Line Properties.
 -
Click the
next to Worksheet Lines. -
Check the box next to the Worksheet grid lines option.
-
Click the word None next to the Worksheet field to select the worksheet containing the grid line column. A list appears from which you can select an existing worksheet to open. Alternatively, you can choose the Browse option to open the Open Worksheet dialog and select a different worksheet file. Click the Open button to exit the Open Worksheet dialog.
-
Select the grid line column from the Column list.
-
Click the
next to the Worksheet line
properties field. Set any line properties for the grid lines.
The grid lines are automatically updated on the axis.