Stiff Plot Axes
Stiff plot X Axes appear on stiff plots. The values of the cations and anions are plotted in milliequivalents per liter on the stiff plot axis. The left side of the axis shows the cation concentrations and the right side shows the anion concentrations. The farther a point is from the center, the larger the ionic concentration.
Stiff axes are created when the stiff plot is created. Stiff axes cannot be added to an existing graph.
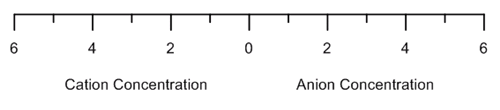
An example stiff plot axis with the two halves of the axis labeled.
Editing an Existing Stiff Axis
To change the features of a stiff axis, click once on the axis in either the plot window or the Object Manager to select it. The properties of the selected axis are displayed in the Property Manager.
Multiple axes can be selected and edited at once. To select multiple axes, click on the first axis to select it. Hold down the CTRL key and click on the second axis In the Object Manager.
Click the following tabs in the Property Manager to change different properties: