Create Your First Graph
You can create graphs in several ways in Grapher. Graphs can be created with
the graph wizard, from the Home | New Graph commands, from
the worksheet, and from templates.
To select the graph you would like to create, click on the image or text that corresponds closest with the graph you would like to create first. We recommend starting with the lesson that best matches the graph you want to create, and completing the others as needed.
|
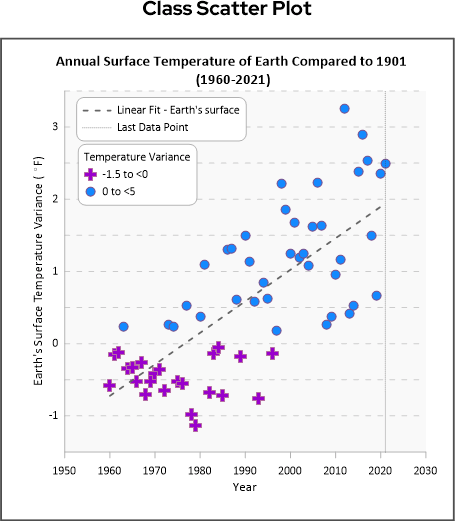
A class scatter plot uses symbols for each XY location based on a third value (Class column). It groups data into categories, with each data point shown using a symbol for its category. |
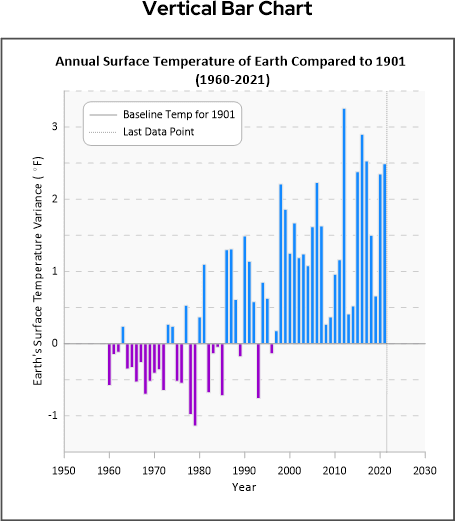
Display data as bars drawn from a base value to a data value. If using multiple variables, the bars can be stacked or placed side by side. The bars can be oriented vertically or horizontally. |
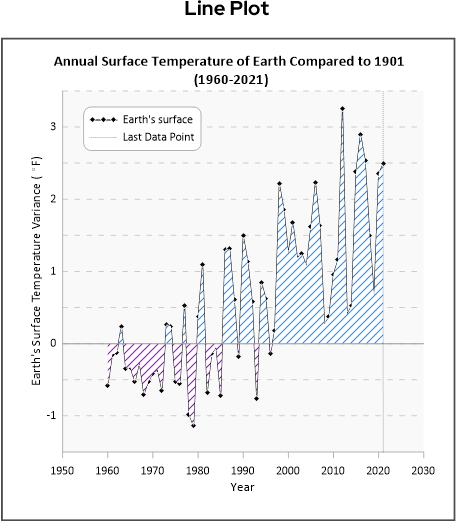
The data is displayed as a line, as symbols, or as a combination of both. It is plotted in the order it appears in the data file. A single graph can contain multiple line/scatter plots. |

|
|