Contour Grid Map
|
Click the Home | New Graph | Contour Surface | XY Contour Grid Map or Home | New Graph | Contour Surface | XZ Contour Grid Map command to create a contour map from a grid file. Contour grid maps are created from grid files, types of which include .GRD, .DEM, .DDF, .HDR, and .DTED. If your data is in a regular array of Z values, you may convert it to an ASCII .GRD file format. Click the XY Contour Grid Map or XZ Contour Grid Map buttons to create contour maps from grid files. |
|

|
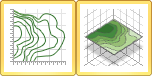
| A contour grid map is created from a grid file. |
A contour map is a two-dimensional representation of three-dimensional data. Two types of contour grid maps may be created: XY grid maps and XZ grid maps.
XY Contour Grid Map
The first two dimensions of the XY grid map are the XY coordinates; the third dimension (Z) is represented by lines of equal value. The relative spacing of the contour lines indicates the relative slope of the surface. The area between two contour lines contains only grid nodes having Z values within the limits defined by the two enclosing contours. The difference between two contour lines is defined as the contour interval.
XZ Contour Grid Map
The XZ contour grid map uses the X and Z axes rather than the X and Y axes. The first two dimensions of the XZ grid map are the XZ coordinates; the third dimension (Y) is represented by lines of equal value. The relative spacing of the contour lines indicates the relative slope of the surface. The area between two contour lines contains only grid nodes having Y values within the limits defined by the two enclosing contours. The difference between two contour lines is defined as the contour interval.
An overlay control is available for XZ contour grid maps. This feature allows you to overlay the XZ contour map on a surface data or surface grid map that is part of the graph. See Plot - Contour Grid Maps for more information.
Creating a New Contour Grid Map
To create a new contour grid map:
- Click the Home | New Graph | Contour Surface | XY Contour Grid Map or Home | New Graph | Contour Surface | XZ Contour Grid Map command.
- Select a data file in the Open Grid dialog. You can select a new grid file or you can select an open grid file in the Open grids section.
- A contour grid map is created using the default properties.
Editing an Existing Contour Grid Map
To change the features of the contour grid map, select the contour grid map and edit its properties in the Property Manager. Click the following tabs in the Property Manager to change different properties: