Confidence Intervals
Confidence intervals provide an estimated range of values calculated from a given set of data that is likely to include an unknown population parameter. A very wide confidence interval suggests that more data should be collected before anything definite can be said about the unknown parameter.
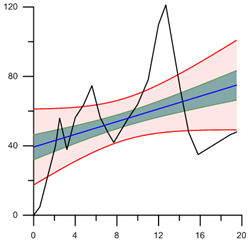
This graph shows a line plot in black,
linear fit curve in blue, and two
confidence intervals in red and green.
In statistics, a confidence interval or confidence bound is an interval estimate of a population parameter. Instead of estimating the parameter by a single value, an interval likely to include the parameter is given. Thus, confidence intervals are used to indicate the reliability of an estimate. How likely the interval is to contain the parameter is determined by the confidence level or confidence coefficient. Increasing the desired confidence level will widen the confidence interval.
This option is not available for the LOESS, spline smoothing, running average, and weighted average fits.
Adding a Confidence Interval to a Fit
To add a confidence interval to a fit:
- Select a fit.
- Click the Plot tab in the Property Manager.
- Click the Add Interval button next to the Confidence command. A confidence interval is added to the selected fit.
Editing Confidence Interval Properties
To change the features of a confidence plot, including the level and the number of iterations, open the confidence level properties by selecting the confidence level and editing the properties in the Property Manager.
You can change the following confidence properties: