Plot - Confidence
To view and edit the confidence plot properties, click on the confidence plot in the Object Manager or plot window. Click on the Plot tab in the Property Manager. You can then change settings for a selected confidence interval in the document.
|
|
|
Set the confidence interval Level and Iterations on the Plot tab of the Property Manager. |
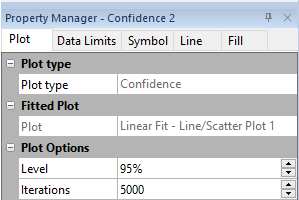
Plot Type
The Plot type property displays the type of plot.
Fitted Plot
The Fitted plot property displays the fit curve and the plot the confidence interval was applied to.
Level
The Level indicates the amount of confidence that a fit curve will appear inside the confidence area. The confidence interval Level value must be between 50 and 99.99.
Iterations
The Iterations value is the number of times the program will try to attempt to create a set of fit curves to plot as the confidence interval. The Iterations value is a number between 100 and 1,000,000.