Grapher User Interface
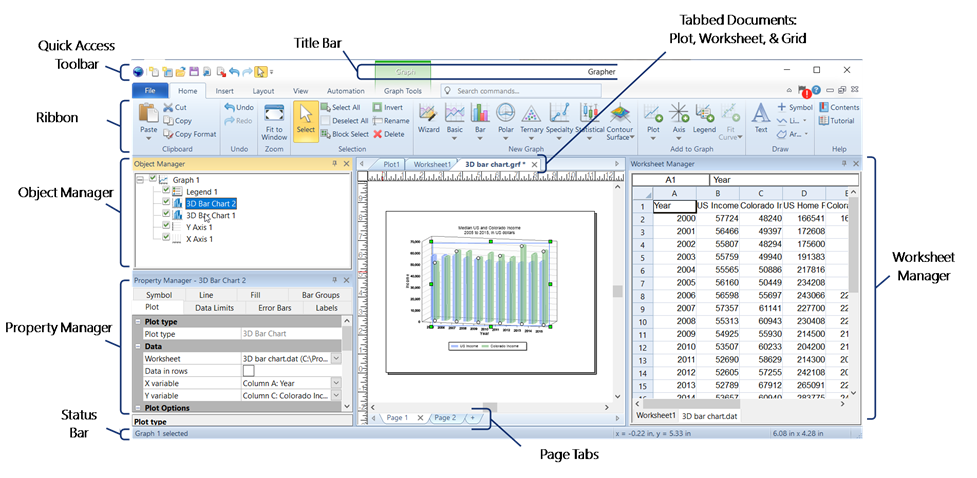
Grapher contains four document window types: the plot window, worksheet window, grid window, and Excel worksheet window. Graphs and maps are displayed and edited in the plot window. Tabular data files are displayed, edited, transformed, and saved in the worksheet window. Grid files can be viewed in the grid window. The Grapher user interface consists of the quick access toolbar, ribbon tabs and commands, tabbed documents, managers, and a status bar.
|
|
|
The Grapher user interface includes several managers and windows with a command ribbon at the top. |
The following table summarizes the function of each component of the Grapher layout.
|
Component Name |
Component Function |
| Ribbon | The ribbon contains the commands used to run Grapher. Some commands are unique to the plot document, worksheet document, and grid document. |
| Tabbed Windows | Multiple plot windows, worksheet windows, Excel worksheet windows and grid windows can be displayed as tabs. Click on a tab to display the window. |
| Plot Window | The plot window contains the graphs and other graphics in one or more pages. |
| Worksheet Window | The worksheet window displays the contents of the plot data sources and data files. |
| Status Bar | The status bar shows information about the activity in Grapher. The status bar is divided into three sections that contain information about the selected command or object position, the cursor position, and the size of the selected object. |
| Page Tabs | A plot document can have multiple pages. By default a plot document is created with a single page. Pages are displayed as tabs at the bottom of the plot window. |
| Object Manager | The Object Manager contains a hierarchical list of objects in a Grapher plot window; these objects can be selected, arranged, and renamed in the Object Manager. The Object Manager is initially docked on the left side above the Property Manager. |
| Property Manager | The Property Manager lists the properties of a selected object. Multiple objects can be edited at the same time by selecting all of the objects and changing the shared properties. The Property Manager is initially docked on the left side below the Object Manager. |
| Script Manager | The Script Manager controls scripts that are recorded and run within Grapher. Right-click in the Script Manager to see relevant menu commands for opening, saving, and running scripts. The Script Manager is hidden by default. |
| Worksheet Manager | The Worksheet Manager contains a view of all data loaded into Grapher. Edits made in the Worksheet Manager are automatically reflected in the graph. Right-click in the Worksheet Manager to save, edit, transform, sort, or obtain statistics on cells. When plots are first created or when they are opened from a GRF file, the data file contents is displayed in the Worksheet Manager. When a GPJ file is opened, the embedded data is displayed in the Worksheet Manager. |
Opening Windows
Selecting the File | Open command opens any of the three window types, depending on the type of file selected. The File | New | Plot command creates a new plot window. The File | New | Plot from Template command opens a new plot window, based on an existing template file. The File | New | Worksheet command creates a new worksheet window. The File | New | Template command creates a new plot window to use as a template file.
Object Manager
When Grapher opens, the Object Manager is visible in the plot window by default. It contains a hierarchical list of the objects in the Grapher plot window. The Object Manager is initially docked at the left side of the window, giving the window a split appearance; however, it can be dragged and placed anywhere on the screen. The Object Manager can also be hidden as a tab, or displayed as a floating dialog.
Ribbon Tabs and Commands
All window types in Grapher include the ribbon that contains all Grapher commands. The ribbon is initially displayed in full size, but can be minimized by right-clicking on the ribbon and selecting Minimize the Ribbon. Then only ribbon tab names are displayed until the ribbon is clicked.
To customize the ribbon, right-click on the ribbon and select Customize the Ribbon. Select any command and click Add to add it to the selected ribbon tab on the left side of the dialog. Commands can only be edited in custom groups or on custom tabs.
Quick Access Toolbar
The Quick Access Toolbar is the toolbar at the top of the screen. This toolbar can be customized to include any commands. To customize the Quick Access Toolbar, right-click on the ribbon and select Customize Quick Access Toolbar. Select any command and drag it to the desired place on the Quick Access Toolbar.
Tab View
The plot, worksheet, and grid windows are displayed as tabbed documents. When more than one window is open, tabs appear at the top of the document, allowing you to click on a tab to switch to a different window. The tabs may be dragged to reorder them. When a document contains unsaved changes, an asterisk (*) appears next to its tabbed name. The asterisk is removed once the changes have been saved. Click the X on the tab to close that tab. If unsaved changes are in the document, a prompt to save the document appears.
