Graph Page - Durov Plots
The Graph page of the Property Manager sets the overall graph properties for the Durov plot. The Graph page includes the property for extending the Durov plot with pH and TDS scatter plots. To edit the graph properties, select the Graph object in the Object Manager.
|
|
|
Extend the Durov plot in the Graph page. |
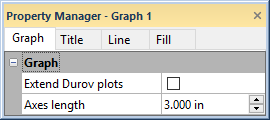
Extend Durov Plots
The Extend Durov plots option adds scatter plots below and to the right of the square plot. Typically the bottom scatter plot displays pH, and the right scatter plot displays TDS (total dissolved solids). Select the Extend Durov plots option to add these scatter plots. Clear the Extend Durov plots option to remove the scatter plots.
Axes Length
The Axes length property set the length for the Durov plot axes. The Axes length property specifies the length of all axes in the Durov plot. It is also possible to change the Durov plot size by clicking and dragging a selection handle or typing a value in the Size ribbon field.