Graph Page - Piper Plots
The Graph page of the Property Manager sets the overall graph properties for the piper diagram. The Graph page includes the property for setting the distance between the diamond and ternary plots in the piper diagram. To edit the graph properties, select the Graph object in the Object Manager.
|
|
|
Set the spacing between plots in the Graph page. |
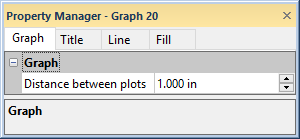
Distance Between Plots
The Distance between plots property specifies the distance between the cation ternary plot Y axis and the diamond plot Y2 Na + K axis. This is the same distance as that between the anion ternary plot Z axis and the diamond plot Z2 CO3 + HCO3 axis. Specify the separation distance by typing a value between 0.100 and 100.000 inches (0.254 and 254.000 centimeters) in the Distance between plots field.
Axes Length
The Axes length property set the length for the Piper plot axes. The Axes length property specifies the length of all axes in the Piper plot. It is also possible to change the Piper plot size by clicking and dragging a selection handle or typing a value in the Size ribbon field.