Adding a Fit Curve
Grapher includes many predefined fit curves as well as a tool for creating custom fit curves. XY and histogram data can be fitted, and statistical information can be displayed for the fit curves in the plot or in a report. To add a fit curve,
-
Click 1Q_Data in the Object Manager to select the scatter plot.
-
Click the Graph Tools | Add to Graph | Fit Curve command. A linear fit is added by default.
-
Click Linear Fit - 1Q_Data in the Object Manager select the fit curve.
-
Click the Plot tab in the Property Manager to display the fit curve properties.
-
Set the Significant digits property to 4.
-
Click Insert next to the Insert into plot document field to add a table of fit statistics to the plot window. The cursor changes to a cross-hair to indicate draw mode.
-
Click the position in the plot window where you want to add the fit statistics.
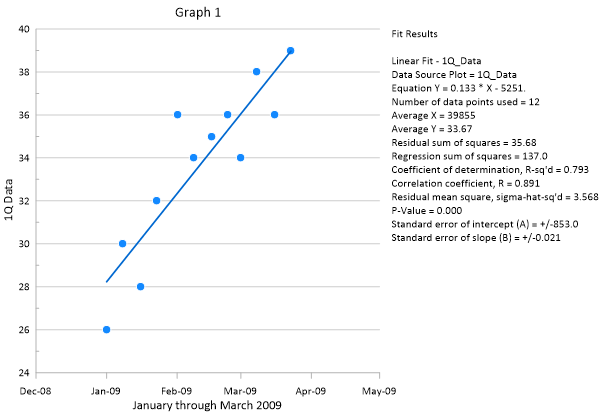
Now a linear fit curve and various fit statistics are displayed in the plot window.
|
|
|
Adding fit curves helps explore and understand possible relationships in the data. |
Back to Changing the X Axis Date/Time Tick Label Format
Next to Stopping and Saving the Script