Adding a Secondary Linked Axis
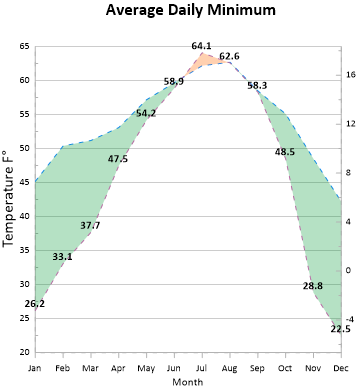
Secondary axes are used to display different scales on the graph. In this example we will add a second Y axis to display temperature in degrees Celsius.
To add a linked axis:
-
Click on the Graph 1 object in the Object Manager.
-
Click the Graph Tools | Add to Graph | Axis | Y Axis command to add a second Y axis.
-
In the Position Y Axis 2 dialog, check the Flip tick marks and labels check box.
-
Click OK.
-
Click the Link Axis tab in the Property Manager to link the new axis.
-
In the Link axis field, click X Axis 1 and select Y Axis 1 from the list.
-
Check the Link limits check box.
-
In the Limits Y = F(X) = field, highlight the current text, type (X-32)*5/9, and press ENTER. The axis limits automatically update to apply the equation to the dependent axis limits. X in the equation refers to the controlling axis. So, the values have 32 subtracted from them and then they are multiplied by 5/9 to convert Fahrenheit values to Celsius values for the new dependent axis.
-
We also want the axis to stay located in the same relative position when the graph moves. Check the boxes next to Link X position and Link Y position. Now, when any portion of the graph is moved, the axis will also move.
-
Click the Line tab to open the Y Axis 2 line properties.
-
In the Grid Line Properties section, clear the Major tick grid line option to remove the Y Axis 2 grid lines.
-
Click the Ticks tab to open the Y Axis 2 tick mark properties.
-
In the Major Ticks section, select the Show ticks on left option.
Now the secondary Y axis is displayed to the right of the graph with a degrees Celsius scale. When the graph is moved or the axis limits change, the Y Axis 2 automatically updates to stay in the same relative location and the same relative axis limits as Y Axis 1. Use the processes from the previous lessons to add an axis title, change the tick mark spacing, and move any overlapping labels if you desire.
|
|
Add multiple axes to display alternate scales on the graph. |
Back to Changing the Tick Labels