Adding a Fill Between Plots
Adding a fill between the two plots will help indicate the difference in values for the plots. Color gradients and/or transparency can be used to enhance the appearance of the fill.
Sometimes, when we add an advanced or complex feature to Grapher, we create one or more Knowledge Base articles. To help you become acquainted with our KBs, try to use this article to learn how to add fill colors Assigning Different Fill Colors Above and Below Intersecting Plots In Grapher.
You can also use these steps to add fill between the plots:
- Click Graph 1 in the Object Manager to select the graph.
- Click the Fill tab in the Property Manager.
- In the Between Plots Fill Properties section, click Add in the Add fill field. The Fills list will be updated with Fill 1.
- Set the Plot 1 property to Site_A.
- Set the Plot 2 property to Site_B.
- In the Fill style (Plot 1 > Plot 2) section, select a Solid Pattern and a Grass Green Foreground color for the fill where Plot 1 is greater that Plot 2.
- In the Fill style (Plot 2 > Plot 1) section, select a Solid Pattern and an Orange Foreground color for the fill where Plot 2 is greater that Plot 1.
- Type 30 in the Foreground opacity property for each plot to set the opacity to 30%.
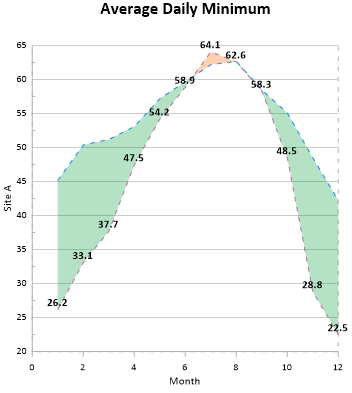
A semi-transparent green fill has been added between the Site_A line plot and Site_B scatter plot.
|
|
|
The fill between plots highlights the difference in values. |
Back to Adding a Graph Title
Next to Lesson 3 - Editing Axes