Lesson 3 - Editing Axes
Grapher's axes can be modified to fit any design needs. The axis scale, axis length, tick mark spacing, tick mark labels, axis titles, colors, etc. can all be customized. Once the axis is selected, all of the axis properties are displayed in the Property Manager. Standard axes have Axis, Break Axis, Ticks, Labels, Link Axis, and Line tabs. The axis title options are on the Axis tab. By default, the axis title is linked to the first row in the data file. In this example, we will change the Y axis title.
-
Click Y Axis 1 in the Object Manager to select the Y axis.
-
Click the Axis tab in the Property Manager to edit the axis properties.
-
In the Title section, click the
 button in the Text field. The Text
Editor opens.
button in the Text field. The Text
Editor opens. -
In the Text Editor dialog, highlight and delete the current linked text, <<@B1>>.
-
Type the word Temperature (F).
-
Click in the space just before the F and click the
 button.
 -
In the Symbol Properties dialog, change the Symbol Set to Calibri and select the degree symbol, Number 144. Click OK to return to the Text Editor. Alternatively, you can click in the space before the F and press and hold the ALT key while typing the number 0176. This will also insert the symbol, without opening the Symbol Properties dialog. This is a good method to use when inserting Unicode or international characters in any text box.
-
Next, let's change the properties of the axis title. In the Text Editor, click and drag to highlight the text Temperature (° F).
-
Highlight the current font size and type 18, to make the font 18 points. The font size is located to the right of the font name in the upper left corner of the dialog. Only the highlighted text changes size, so be sure to select all of the text.
-
Click OK to close the Text Editor and save the changes to the axis title.
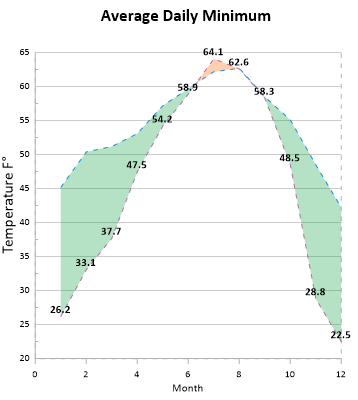
The text Temperature (°F) now appears along the Y axis.
|
|
Add axis titles by selecting the axis and then adding the Text in the Axis page of the Property Manager. |
Back to Adding a Fill Between Plots
Next to Changing Tick Mark Spacing