Adding a Graph Title
Graph properties control settings that affect the entire graph, such as titles, background line and fill colors, and fill patterns that fill between multiple plots. Let’s edit the graph title and add a fill between the plots in the graph.
To add a graph title:
-
Click on the Graph 1 object in the Object Manager to select the entire graph.
-
Click on the Title tab in the Property Manager.
-
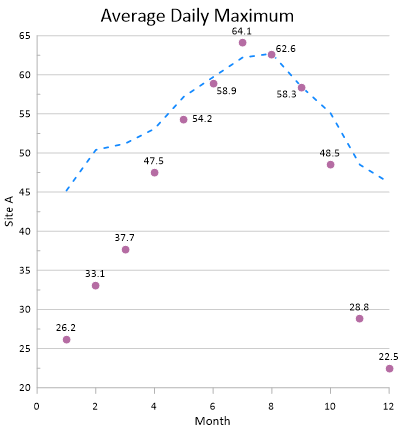
In the Text property field, delete Graph 1 and type the graph title, Average Daily Maximum.
-
Click the
 button next
to Font to open the
section, if necessary.
button next
to Font to open the
section, if necessary. -
Highlight the current Size (points) value and change it to 24.
The Text and Font properties can be used to quickly add and modify a simple text title. The Text Editor can be used to add multiple lines and various fonts, sizes, and colors to the title.
|
|
Add a graph title to display additional information about the graph. |
Back to Moving Labels
Next to Adding a Fill Between Plots