Editing Grid Lines - Tutorial
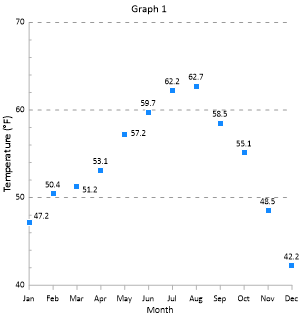
Grid lines make it easier to see how the data relate to the axes. By default, grid lines are displayed at major ticks on the Y axis. You can add grid lines at major tick marks, minor tick marks, or at values specified in a data file. All of the line properties, such as color, width, opacity, and style, can also be edited for each type of grid line separately.
To edit the grid line properties:
- In the Object Manager, click Y Axis 1 to select the Y axis.
- Click on the Line tab to open the grid line properties.
- Click the
 next to Grid Line Properties to open the section, if necessary.
 - Click the next to the Major grid lines to open the section, if necessary.
- Click the next to Major line properties to open the section, if necessary.
- Click the current style next to the Style property. In the line style palette, click the .1 in. Dash line style to select it.
- Click on the current color next to the Color option. In the color palette, click on the 40% Black color, which is in the top row and seventh column in the color palette. Once you click on the 40% Black color, the palette closes and the graph is updated with the newly colored grid lines.
|
|
The grid lines can be a custom line color or style. |
Back to Changing the Tick Labels
Next to Adding a Secondary Linked Axis