Adding a New Plot
You can add several plots to one graph in Grapher. In Tutorial.xlsx, columns B through I are additional Y data, making it simple to add additional plots to the graph. To add a plot to the graph:
-
Click Site_A in the Object Manager to select the existing line plot.
-
Click the Plot tab in the Property Manager.
-
In the Add to Graph section, click Create next to the New plot field to add a new plot to the graph.
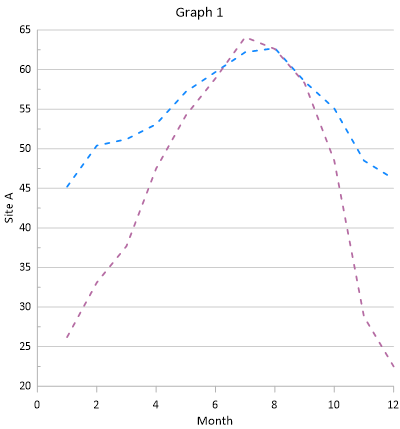
Clicking the Create button creates a new line/scatter plot using the same worksheet as the original plot. The same axes and plot properties are also used for the new plot, the plot color is automatically changed. The X column stays the same and the Y column increments to the next column with data. The new plot is selected after the command is executed. The Property Manager title changes to Property Manager - Site_B and the Y variable changes to Column C: Site B.
The New plot feature in the Plot page only creates plots from the original plot's data file. In addition, not all plot types have this option. When many plot types are selected, the Graphs | Add to Graph commands are available. These allow additional axes, duplicate axes, plots from a different data file, legends, summation plots, and magnifiers to be added to the selected graph. For additional information on this command, see Plot - Add to Graph. The Graph Wizard can also be used to quickly create a graph with multiple plots from a single data file.
|
|
The second line plot is added to the graph using the same axes and properties as the first plot. |
Back to Changing the Line/Scatter Plot Properties
Next to Changing the Plot Type