Changing the Plot Type
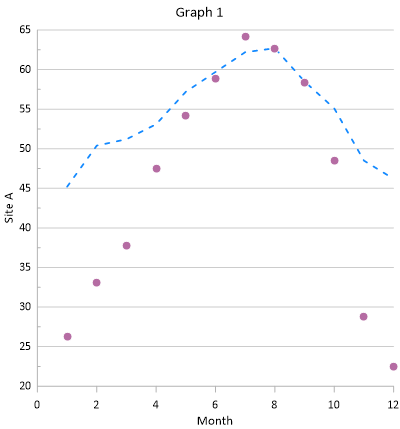
Let's change the new line plot to a scatter plot to differentiate between the two curves. A line plot can become a scatter plot by editing the LineandSymbolproperties in theProperty Manager. There is also a shortcut to changing between plot types. To change the line plot into a scatter plot:
-
Click Site_B in the Object Manager.
-
Click the Graph Tools | Convert | Plot Type | Scatter command. The line plot changes to a scatter plot.
The Graph Tools | Convert | Plot Type command is not available for all plot types. It can be used to convert line, scatter, line/scatter, step, and bar charts to other line, scatter, line/scatter, step, and bar charts. The Graph Tools | Convert | Graph to 2D/3D command can be used to convert a 2D graph to a 3D graph, or vice versa, when the entire graph is selected.
|
|
|
You can change the properties in the new plot to distinguish it from the first plot. |
Back to Adding a New Plot
Next to Displaying Plot Labels