Plot Page - Surface Grid Maps
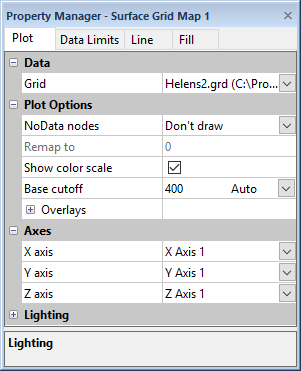
To view and edit surface grid map plot properties, first select the map and then click the Plot tab in the Property Manager. You can then change the grid file; change axes; handle NoData nodes; and display or hide the color scale in the surface grid map.
Click one of the Plot page section names in the list below to read more information about the properties in those sections or follow this help topic sequentially to read about each property.
|
|
|
Set the surface map properties on the Plot tab in the Property Manager. |
Plot Type
The Plot type property displays the type of plot.
Data
Grid
Click the current grid file path and file name next to Grid to select a different grid file for the plot. Click on a currently open grid or click the Browse option to navigate to a grid that is not yet open. Select a different data file in the Open Worksheet dialog, and click the Open button to change the grid file. The plot automatically updates.
Plot Options
NoData Nodes
The NoData nodes option sets the method used to treat nodes that have no value, i.e. the NULL value, associated with it. Set the NoData nodes to Don't draw to not draw the NoData nodes. Choose the Remap option to change how the NoData nodes are mapped, then enter a new value in the Remap to field. The Remap to value is in Y axis units.
Show Color Scale
Check the box next to the Show color scale option to show the surface data map's color scale.
Base Cutoff Value
The base extends from the bottom of the surface to the Base cutoff value. By default, no base is displayed. To add a base to the map, select a base fill style on the Fill page. The base line and fill properties are edited on the Line and Fill pages.
Control the limits of the base fill by setting Base cutoff value. The Base cutoff value is in Y axis units. If Auto is selected for the Base cutoff, a reasonable Y axis value is selected for the value. To limit the range base, you can change the Base cutoff, click the word Auto. It will change to Custom. You can then enter a new value into the Base cutoff box.
Overlays
The Overlays section includes the properties for overlaid maps or plots.
Resample Method
When the texture map is stretched, the color in the original overlay must be resampled to a new size and position. The Resample method specifies how the texture map is resampled. Setting the option to Linear uses bilinear interpolation to combine the four surrounding pixels. Bilinear interpolation results in higher quality, but is usually slower. Setting the option to Nearest uses the nearest pixel in the source image. To change the Resample method, click on the existing method and select the desired method from the list.
Overlay Resolution
The Overlay resolution refers to the resolution of the texture map. High-resolution texture maps result in more detail, but lines become thinner and may eventually fade or break up. Setting the Overlay resolution to Automatic allows Grapher to determine the best resolution. To change the resolution, click on the existing value and select a new option from the list.
Color Modulation
Color modulation refers to the method used to combine the texture map and surface material colors. You can choose to use only the overlay colors (such as contour map colors), or you can blend the surface and overlay colors. To change the Color modulation , click the existing option
Overlay Visibility
If there are overlays on a surface, and the surface is made invisible through the Object Manager, the overlays will not be visible.
To overlay a contour map and surface map:
- Create a contour map using the Home | New Graph | Contour Surface | XZ Contour Data Map or Home | New Graph | Contour Surface | XZ Contour Grid Map or Home | New Graph | Function | XZ Contour Function Map commands.
- Add a surface map to the graph using the Graph Tools | Add to Graph | Plot command.
- Select a Surface Function Map, Surface Data Map, or Surface Grid Map and click OK.
- Select the axes and click OK.
- Select the data file or grid file and click Open.
- Click on the contour map in the Object Manager or plot window to select it.
- In the Property Manager, click on the Plot tab. Change the Overlay to the surface map.
- Click on the surface map in the Object Manager or plot window to select it.
- In the Property Manager, click on the Plot tab. Set any desired overlay properties.
Axes
Click on the axis name next to the X axis, Y axis, or Z axis fields to change the axes used for the plot. Select another axis name from the list. Alternatively, click Select plots/axis to change the axis used by several plots on a graph at once.
See the Axis - Add to Graph page for information about how to add a new axis to the graph. Once the new axis is added to the graph, it will be available in the X axis, Y axis, or Z axis lists.
Lighting Properties
The Lighting section includes the lighting properties for the 3D surface.