Labels - High-Low-Close Plots
Data point labels can be shown on most plot types in Grapher. The labels can show data values or information from some other column in the data file. Labels can also be customized to appear in specific locations and can use a variety of formats, fonts, and colors to optimize the look and feel of the graph.
The following information is for the options contained on the Labels tab for hi-low-close plots. To edit the labels, click on a high-low-close plot to select it. In the Property Manager, click on the Labels tab.
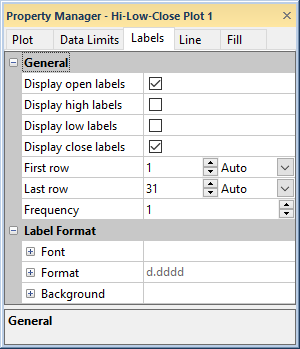
Set label properties in the Property Manager on the Labels tab.
Display Labels
Check the Display open labels, Display high labels, Display low labels, or Display close labels boxes to display the open, high, low, or close label values. You can choose to display any combination of these labels.
Worksheet Rows
You can choose the range of rows to plot labels in the Worksheet
rows group. Click the ![]() next to Worksheet rows to see the options.
The default rows are the first and last rows containing data.
next to Worksheet rows to see the options.
The default rows are the first and last rows containing data.
If Auto is selected for the First row and Last row, the first through last rows containing data are used as labels. To limit the range of the plotted labels, you can change the range of rows. Click on the word Auto to change it to Custom. Then highlight the existing value and type a new row number value. To return to the default values, click the word Custom and select Auto and First row or Last row will revert to the default rows.
Frequency
Use the Frequency to control the number of labels in the plot. A Frequency of 1 displays a label for every data row. If the Frequency is set to 3, every third data point is labeled.
Label Format
The Label Format section includes the Font, Format, and Background properties for the plot labels.
Label Font
Click the ![]() next to Font to set the label
font properties. The font
Face, Size (points), Color, Opacity,
Bold, Italic, Underline, and Strikethrough properties can be set for most labels.
next to Font to set the label
font properties. The font
Face, Size (points), Color, Opacity,
Bold, Italic, Underline, and Strikethrough properties can be set for most labels.
Label Format
Click the ![]() next to Format to set the label format properties. The label
Type, display of numbers, Prefix, and
Suffix can be set for labels.
next to Format to set the label format properties. The label
Type, display of numbers, Prefix, and
Suffix can be set for labels.
Label Background
Click the ![]() next to Background to set the
label background properties. The Background
is the area behind the label. Click the
next to Background to set the
label background properties. The Background
is the area behind the label. Click the  next to Line
to set the line properties for the line that goes around the text.
Click the next
to Fill to set the fill properties
for the area around the text.
next to Line
to set the line properties for the line that goes around the text.
Click the next
to Fill to set the fill properties
for the area around the text.