Date/Time Labels
This section does NOT apply to date/time-formatted data in worksheet columns. If you are using data in a worksheet that is already formatted as dates and times, change the Label source to Automatic and check the Use date/time format option.
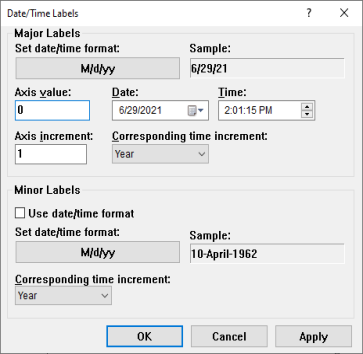
If you have evenly spaced numeric data that you would like to represent as date and time, set the Label source to Numeric date/time on the Labels tab in the General section. Click the Set button next to Date/time settings to open the Date/Time Labels dialog.
Use the Date/Time Labels dialog
to customize date/time labels.
Format
The format displayed under Set date/time format is the format that you want the label to display. Click the current format to select or create a date/time format in the Date/Time Format Builder dialog.
Sample
A sample of the selected format appears in the Sample box.
Axis Value and Corresponding Date/Time
The Axis value is the numeric value in the worksheet that equals a specific date and time. If a numeric data column is used to create the graph, enter the data value that equals the corresponding time label. Use a row number if the row number or sequence number options are used to create the graph. To change the Axis value, highlight the existing value and type a new value.
Select the Date and Time
of the Axis value in the boxes
to the right of the Axis value.
To change the Date, highlight
an existing value and type a new value. Alternatively, click the ![]() to show a calendar. Click the appropriate
day on the calendar.
to show a calendar. Click the appropriate
day on the calendar.
Axis Increment
The Axis increment is the number of data units in a specified time unit. Make sure the tick mark spacing is appropriate for the axis increment setting. To change the Axis increment, highlight the existing value and type a new value.
Corresponding Time Increment
The Corresponding time increment is the unit of time applied to the Axis increment value. To change the Corresponding time increment, click on the existing option. In the list, select the new option. Select Year, Month, Week, Day, Hour, Minute, or Second.
Minor Labels
Check the box next to the Use date/time format command in the Minor Labels section to use date/time formatting for both the major labels and minor labels. If this option is not checked, the minor labels will show only numbers.
Check the box next to the Auto select time increment to allow Grapher to determine automatically the interval for the minor labels. When this box is unchecked, you can set the Corresponding time increment.
Select the Format of the minor label from the format list. This is the format that you want the minor labels to display.
Select the Corresponding time increment from the list. This is the increment to display minor labels.
OK, Cancel, and Apply
Click the OK button to make the changes and close the Date/Time Labels dialog. Click Cancel to return to the plot window without making the changes. Click Apply to make the changes and keep the dialog open. This allows you to see the changes you have made and make additional changes before closing the dialog.
Example
An observation is recorded once a day for 21 days. The data are plotted using the row number for X and the observation value for Y. The first row contains headers and the data begins on row 2. The following steps show how to plot month-day-year labels on the X Axis for each data point.
- Select the X Axis by clicking on it in the Object Manager or plot window.
- Click on the Ticks tab in the Property Manager and set the major tick mark Spacing to 1.
- Click on the Labels tab in the Property Manager and set the major tick label Angle to 90.
- In the General section, change the Label source to Numeric date/time.
- Click the Set button next to the Date/time settings option to open the Date/Time Labels dialog.
- In the Date/Time Labels dialog, click the current date time format under Set date/time format. The Date/Time Format Builder dialog opens.
- In the Date/Time Format Builder dialog, select MMMM dd, yyyy from the Predefined date/time formats list.
- Click the Insert button next to the MMMM dd, yyyy format. The Date/Time format (edit to change) field is updated with the selected format.
- Click OK in the Date/Time Format Builder dialog.
- Since the data begin on row 2 (headers are in row 1), the axis minimum is two. Set the Axis value to 2.
- The first day of the observations is January 15, 2011, so set the Date to 1/15/2011. You can enter the month, day, and year or you can select the date from a calendar by clicking the down arrow to the right of the date. Set the hours, minutes, and seconds to 12:00:00 AM to set the time to midnight.
- Set the Axis increment to 1 since there is an observation once a day. Each row is a new observation and increases by a value of 1.
- Set the Corresponding time increment to Day because each new row is a new day. The increment 1 is now linked to a day.
- Click the OK button to save your changes and close the Date/Time Labels dialog.
The axis labels appear once a day with dates beginning at January 15, 2011 and ending on February 4, 2011.
Tips About Date/Time Labels
There are three ways to show date/time tick mark labels in Grapher, depending on your data:
- If you have evenly spaced numeric data that you would like to represent as time, you can select Numeric date/time as the Label source in the axis properties Labels section as described above.
- If the time increments are unevenly spaced, change the Label source to From worksheet to generate date/time labels. The labels must appear in the worksheet in the format that you wish to see on the graph.
- If the data are already in a date/time format in the worksheet, set the Label source to Automatic and check the Use date/time format option.