Worksheet Labels
Display text or symbol labels in Grapher using worksheet labels. The labels and tick marks are entered into a data file and used as major tick mark labels on the specified axis.
Setting up the Data File
Using text labels from a data file requires two columns of information. These columns can be contained in the data file used to create the graph or they can be included in a separate data file.
One of the columns needs to contain tick mark locations. The tick mark locations do not need to be evenly spaced, though they must use the same data units and in the same general range as the data used for the axis. The tick mark locations can be the same information as the X or Y data, although this is not necessary.
The second column contains the text for the axis labels. Any text that can be entered into the worksheet can be displayed on an axis. Match the label column to the appropriate data in the tick mark column to display the labels on the appropriate tick marks. To plot symbols in labels, use Math Text.
Example 1
A data file contains temperature with a range of 26 to 68 degrees Fahrenheit. The tick mark labels should be displayed with degree symbols (26°F). The data are dense enough that displaying a tick mark for each data point would cause the labels to overlap. Therefore, the tick marks are displayed in custom locations using the From worksheet option.
The tick mark and label columns would appear like this:
|
Tick Mark Locations |
Labels |
|
20 |
20\f"Symbol" \a176 \f"Arial" F |
|
30 |
30\f"Symbol" \a176 \f"Arial" F |
|
40 |
40\f"Symbol" \a176 \f"Arial" F |
|
50 |
50\f"Symbol" \a176 \f"Arial" F |
|
60 |
60\f"Symbol" \a176 \f"Arial" F |
|
70 |
70\f"Symbol" \a176 \f"Arial" F |
The \f"Symbol" \a176 \f"Arial" F in the labels column are math text directions for the degree symbol plus the letter F.
To create custom tick marks and labels with symbols:
-
Select an axis.
-
Click on the Labels tab in the Property Manager.
-
In the General section, select From worksheet as the Label source.
-
Select a worksheet from the Worksheet list or click the Browse option to open the Open Worksheet dialog to select a data file. Click the Open button once you have selected the data file.
-
Set the Data column to the column containing the tick mark locations.
-
Selecting the Row number option plots the axis with the row numbers used in the Worksheet rows group on the graph properties plot page. For example, if the first row is number two, the axis begins at two.
-
The Sequence number option plots the data according to the total number of rows used. The sequence number always begins with number one no matter which rows are selected in the Worksheet rows group on the graph properties plot page.
-
In the General section, set the Label column to the column containing the tick labels.
-
In the Worksheet rows section, set the First row and Last row as needed to limit the tick labels.
Example 2
Axis labels can be added to specific locations on the axis and with unique text by using worksheet axis labels.
To add custom axis labels to the graph:
-
Type the data values of the axis labels into a column in a data file. For example, to place labels at axis values three, seven, nine, and twelve, enter 3, 7, 9, and 12 into an empty data column. This data file does not need to be the same data file used to create the graph.
-
In another column, type the label to be displayed for each axis value. The label should be on the same row as the axis value. Your worksheet may look like:
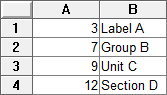
The Data value is in column A.
The label is in column B.
-
In the plot window or Object Manager, click on the axis to select it.
-
In the Property Manager, click on the Labels tab.
-
In the General section, set the Label source to From worksheet.
-
Click the word None next to the Worksheet field to select the worksheet containing the labels. A list appears from which you can select an existing worksheet to open. Alternatively, you can choose the Browse option to open the Open Worksheet dialog and select a different worksheet file. Click the Open button to exit the Open Worksheet dialog.
-
In the Worksheet rows section, set the First row and Last row, if necessary. For instance, if you only want to display the labels at 3, 7, and 9, you could set the Last row to row 3.
-
Set the Data column to the column that contains the actual axis data values. In the example worksheet above, this is Column A.
-
Set the Label column to the column that contains the label to be displayed. In the example worksheet above, this is Column B.
-
Set any additional tick label properties.
The tick labels are automatically updated on the axis.
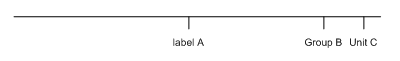
The axis is displayed with tick marks set by the Data column value
and tick labels set by the Label column text.