Add a Secondary Axis
Secondary axes are often used to display different scales on a graph. In this example we will add a second Y axis to display temperature variance in degrees Celsius.
To add a linked axis:
-
Click on the Graph 1 object in the Object Manager.
-
Click the Graph Tools | Add to Graph | Axis | Y Axis command to add a second Y axis.
-
In the Position Y Axis 2 dialog, check the Flip tick marks and labels check box.
-
Click OK.
-
Click the Link Axis tab in the Property Manager to link the new axis.
-
In the Link axis field, click X Axis 1 and select Y Axis 1 from the list.
-
In the Limits/Spacing section, check the Link limits check box.
-
In the Limits Y = F(X) = field, select the current text, enter X*5/9, and press ENTER. The axis limits automatically update to apply the equation to the dependent axis limits. X in the equation refers to the controlling axis. So, the values are multiplied by 5/9 to convert change in Fahrenheit values to change in Celsius values for the new dependent axis.
-
We also want the axis to stay located in the same relative position when the graph moves.
-
In the Length/Position sections, check the boxes next to Link X position and Link Y position.
-
-
We can align the two Y axes vertically as well.
-
In the Length/Position sections, for the Y position field, click the drop down and select None.
-
-
Click the Line tab to open the Y Axis 2 line properties.
-
In the Grid Line Properties section, clear the Major tick grid line option to remove the Y Axis 2 grid lines.
-
Click the Ticks tab to open the Y Axis 2 tick mark properties.
-
In the Major Ticks section, select the Show ticks on left option.
-
In the Minor ticks section, uncheck the Show ticks on left option.
Now the secondary Y axis is displayed to the right of the graph with a degrees Celsius variance scale. When the graph is moved or the axis limits change, the Y Axis 2 automatically updates to stay in the same relative location and the same relative axis limits as Y Axis 1. Use the processes from the previous lessons to add an axis title, change the tick mark spacing, and move any overlapping labels if you desire.
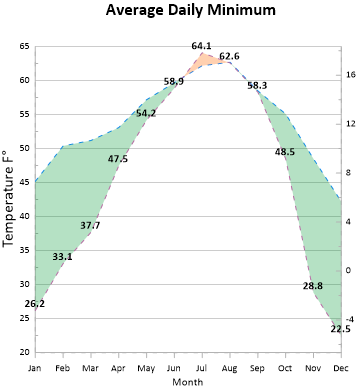
Add multiple axes to display alternate scales on the graph.
Use the Advanced Lessons button to choose to go over another advanced lesson
|
|