Plot Page - Polar Function Plots
To view and edit function plot properties, click on the function plot in the Object Manager or plot window to select it. Click the Plot tab in the Property Manager. You can change the equation for the polar function plot.
|
|
|
Change the polar function plot properties in the Property Manager on the Plot tab. |
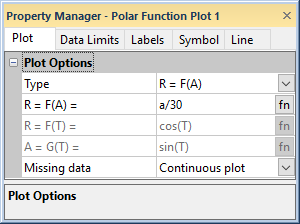
Plot Type
The Plot type property displays the type of plot.
Type
The Type option determines if the plot is created with a set of equations or a single equation. When the Type field is set to R = F(A), the function is entered in the form R as a function of A in the R = F(A) = field. If Type is set to Parametric, enter R and A as functions of T in the R = F(T) = and A = G(T) = fields.
Function
Enter the function equation in the R = F(A) = box. For parametric equations, enter the A portion of the equation in the A = G(T) = box. Enter the R portion of the equation in the R = F(T) = box. To change the equation, highlight the existing equation. Type a new equation in the box and press ENTER.
In both cases, you can click the ![]() button to open the Functions dialog
and add predefined mathematical
functions to the equation or you can type the functions into the fields
manually.
button to open the Functions dialog
and add predefined mathematical
functions to the equation or you can type the functions into the fields
manually.
Missing Data
Rows containing text or blanks in the plotted columns are ignored and are not plotted on the graph. You can display the missing data as part of a continuous or discontinuous line using the Missing data options. Setting Missing data to Continuous plot connects the data line before and after the missing data. Setting Missing data to Discontinuous plot breaks the line at the missing data sections of the data set. Missing data is not available for all plot types.
Example 1
To create a polar function plot using the equation R=3-COS(A):
- Create a new function plot by clicking the Home | New Graph | Function | Polar Function Plot command.
- With the polar function selected, click the Plot tab in the Property Manager.
- Highlight the contents of the R = F(A)= box and then type 3 -COS(D2R(A)). The function D2R(A) converts the angle in degrees to radians, because the cosine function argument unit is radians.
- Click the Data Limits tab.
- Change the First value to 0.
- Change the Lastvalue to 180.
Example 2
To create a parametric function based on R = 2t and A = t2 -1:
- Create a new function plot by clicking the Home | New Graph | Polar | Polar Function Plot command.
- Click the Plot tab in the Property Manager to access the Plot Properties page.
- Highlight the contents of the R = F(T)= field and enter 2*T.
- Highlight the contents of the A= G(T)= field and type t^2 - 1.
- Click the Data Limits tab.
- Change the First value to 0.
- Change the Lastvalue to 25.