Plot Properties - Math Plot
The math plot properties Plot page contains the options to change the axes, set the number of points, and control the equation used to create the math plot. To view and edit math plot properties, click on the math plot in the plot window or Object Manager to select it. Then, click on the Plot tab in the Property Manager.
|
|
|
Set the math plot properties in the Property Manager on the Plot tab. |
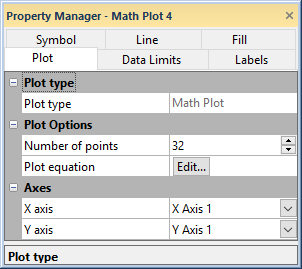
Plot Type
The Plot type property displays the type of plot.
Number of Points
The Number of points option sets the number of times the math plot value is calculated. The math plot evaluates the Plot equation at equally spaced intervals between the X minimum and X maximum. The interval between the points is set by the Number of points value. If the X values do not coincide with the source data, then the Y values are determined by linear interpolation between the two nearest data points. Therefore, if the X values are not shared among all component plots OR if the X values are not equally spaced, consider increasing the Number of points to 1000.
By default, the Number of points is equal to the maximum number of data points in the component plots. The value must be >= 2 and <= 2.14748e+009. The larger the value, the longer it will take to generate the math plot and update changes on the plot.
Plot Equation
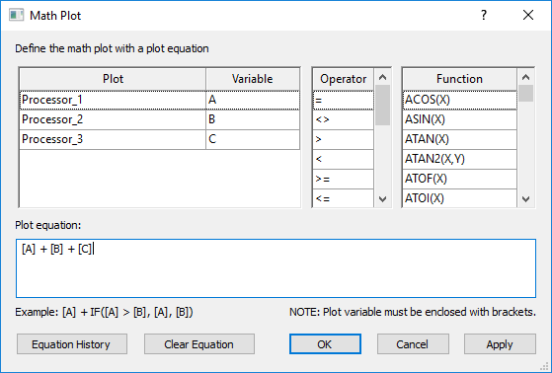
The Plot equation property includes a list of all of the plots in the graph. Click the Edit button next to Plot equation to open the Math Plot dialog. In the Math Plot dialog, specify the equation for creating the math plot, including which plots are included in the math plot.
|
| Set the plot equation for the math plot in the Math Plot dialog. |
Math Plot Equation
Define the math plot equation by typing the equation directly in the Plot equation field. You can also create the plot equation by double-clicking items in the Plot, Variable, Operator, and Function lists. The Plot equation can include plot variables in square brackets, [], operators, and mathematical functions.
Plot variables can be specified by the plot name, e.g. [Processor_1], or by the variable, e.g. [A] in the Math Plot dialog. If the order of the plots is changed in the Object Manager, the plot variables automatically update to keep the math plot results the same.
Click Clear Equation to clear the Plot equation field.
Equation History
Click Equation History to display a list of previously used equations in the Expression History dialog. Double-click or select an equation and click OK to reuse a Plot equation.
Change Axes
Click on the axis name next to the X axis or Y axis fields to change the axes used for the plot. Select another axis name from the list. Alternatively, click Select plots/axis to change the axis used by several plots on a graph at once.
See the Axis - Add to Graph page for information about how to add a new axis to the graph. Once the new axis is added to the graph, it will be available in the X axis, Y axis, or Z axis lists.