Plot Page - Contour Function Maps
To view and edit contour function map plot properties, select the map and then click the Plot tab in the Property Manager . You can then change the function, axes, and worksheet columns and rows in the contour function map. The properties available will be specific to the type of plot.
Click one of the Plot page section names in the list below to read more information about the properties in those sections or follow this help topic sequentially to read about each property.
NOTE: The line properties for NoData regions are specified on the Line page in the NoData Line Properties section. The fill properties for NoData regions are specified on the Fill page in the NoData Fill Properties section.
|
|
|
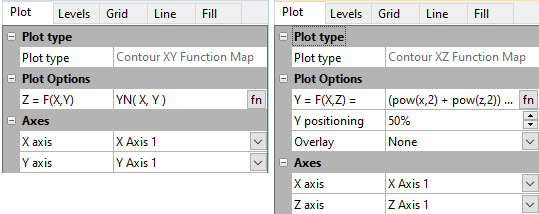
Example Contour XY and XZ Function Map Plot pages |
Plot Type
The Plot type property displays the type of plot.
Plot Options
Set Equation for Y
For an XZ contour function map, select the text next to Y
= F(X,Z) = to change the function being plotted for Y. Click the
![]() button to open the Functions dialog
and add predefined mathematical equations to the function, or type functions
into the field manually.
button to open the Functions dialog
and add predefined mathematical equations to the function, or type functions
into the field manually.
Set Equation for Z
For an XY contour function map, select the text next to Z
= F(X,Y) = to change the function being plotted for Z. Click the
![]() button to open the Functions dialog
and add predefined mathematical equations to the function, or type functions
into the field manually.
button to open the Functions dialog
and add predefined mathematical equations to the function, or type functions
into the field manually.
Y Positioning
On XZ contour function maps, the Y positioning adjusts the position of the XZ contour map on the Y axis. This number is expressed as a percentage of the total Y axis length, e.g., an entry of “50%” will position the XZ contour map about halfway up the Y axis.
Overlay
On XZ contour function maps, select a surface map from the list next to Overlay on which to overlay the XZ contour map. Note: the surface map must be part of the same graph as the XZ contour map. All surface maps in the existing graph will be listed.
To overlay a contour map and surface map:
- Create a contour map using the Home | New Graph | Contour Surface | XZ Contour Data Map or Home | New Graph | Contour Surface | XZ Contour Grid Map or Home | New Graph | Function | XZ Contour Function Map commands.
- Add a surface map to the graph using the Graph Tools | Add to Graph | Plot command.
- Select a Surface Function Map, Surface Data Map, or Surface Grid Map and click OK.
- Select the axes and click OK.
- Select the data file or grid file and click Open.
- Click on the contour map in the Object Manager or plot window to select it.
- In the Property Manager, click on the Plot tab. Change the Overlay to the surface map.
- Click on the surface map in the Object Manager or plot window to select it.
- In the Property Manager, click on the Overlays tab. Set any desired overlay properties.
Axes
Click on the axis name next to the X axis, Y axis, or Z axis fields to change the axes used for the plot. See the Axis - Add to Graph page for information about how to add a new axis to the graph. Once the new axis is added to the graph, it will be available in the X axis, Y axis, or Z axis lists.