Plot Page - Contour Grid Maps
To view and edit contour data map plot properties, select the map and then click the Plot tab in the Property Manager. You can then change the data file, axes, and worksheet columns and rows; show or hide fill contours and color scales; configure blanking lines and fills; and set or reset levels in the contour grid map.
NOTE: The line properties for NoData regions are specified on the Line property page in the NoData Line Properties section. The fill properties for NoData regions are specified on the Fill page in the NoData Fill Properties section.
|
|
|
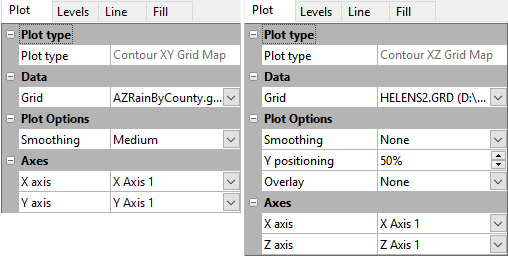
Example Contour XY and XZ Grid Map Plot properties |
Plot Type
The Plot type property displays the type of plot.
Data
Grid
Click the existing grid file path and file name next to Grid to select a different grid file for the plot. Click on a currently open grid file or click the Browse option to navigate to a grid file that is not yet open. Select a different grid file in the Open Worksheet dialog, and click the Open button to change the data. The plot automatically updates.
Plot Options
Smoothing
The Smoothing option applies a smoothing algorithm to the contour lines. To change the Smoothing option, click on the existing option and select a new one from the list. Available options are Low, Medium, and High. The more smoothing that is applied, the more likely that contour lines could cross or be located incorrectly based on the gridded values.
Y Positioning
On XZ contour grid maps, the Y positioning adjusts the position of the XZ contour map on the Y axis. This number is expressed as a percentage of the total Y axis length, e.g., an entry of “50%” will position the XZ contour map about halfway up the Y axis.
Overlay
On XZ contour grid maps, select a surface map from the list next to Overlay on which to overlay the XZ contour map. Note: the surface map must be part of the same graph as the XZ contour map. To change the Overlay, click on the existing option and select the new option from the list. All surface maps in the existing graph will be listed.
To overlay a contour map and surface map:
- Create a contour map using the Home | New Graph | Contour Surface | XZ Contour Data Map or Home | New Graph | Contour Surface | XZ Contour Grid Map or Home | New Graph | Function | XZ Contour Function Map commands.
- Add a surface map to the graph using the Graph Tools | Add to Graph | Plot command.
- Select a Surface Function Map, Surface Data Map, or Surface Grid Map and click OK.
- Select the axes and click OK.
- Select the data file or grid file and click Open.
- Click on the contour map in the Object Manager or plot window to select it.
- In the Property Manager, click on the Plot tab. Change the Overlay to the surface map.
- Click on the surface map in the Object Manager or plot window to select it.
- In the Property Manager, click on the Plot tab. Set any desired overlay properties.
Axes
Click on the axis name next to the X axis, Y axis, or Z axis fields to change the axes used for the plot. See the Axis - Add to Graph page for information about how to add a new axis to the graph. Once the new axis is added to the graph, it will be available in the X axis, Y axis, or Z axis lists.