Populate Template window
To fill a selected template with your own data, first open the template file. Then, click the Template | Populate Template command to open the Populate Template window. This window allows you to load your data files, assign specific data files and columns to the graph.
![]()
The Populate Template window without any data loaded.
Load Data Files
Begin by loading your data files by clicking on the browse button and locating the data file you want to use. You can load multiple data files, including worksheets and grid files. As you select different loaded files, you'll see a preview of the data in the worksheet preview section of the dialog.
Assign data file and variables to objects
Grapher will automatically try to match the data based on the original file format. For the best experience, it's recommended to use a worksheet that has the same structure as your original data. For each object select the file that the data is located in, the data layout, and the variable that should be used. Utilize the worksheet preview and the graph preview to confirm you have the settings and data desired.
Data Preview
The data preview window offers a look at the contents of your loaded data file. It displays a sample of the data, allowing you to verify its structure and contents before proceeding. This helps ensure that the data is formatted as expected for the template graph.
Graph Preview
The graph preview window is a helpful tool that provides a live view of your graph as you make adjustments. The preview will not be displayed until all items in a graph are complete. After that it reflects changes in real time, allowing you to see the immediate impact of your modifications.
Retain original Axis settings
Selecting 'Retain original axis settings' will keep the axis limits and scales from your initially loaded data file, even when you load a new dataset. This option prevents Grapher from automatically adjusting the axes to fit the new data range, allowing for consistent comparisons across different datasets. For example, if your original data ranged from 0 to 100 on the y-axis, loading new data with a range of 20 to 50 will still display the y-axis from 0 to 100.
Close / Complete
Click the Complete button when finished assigning the data. Should the Close button be displayed in lieu of Complete, this indicates that not all requisite worksheet references have been loaded. If you click the Close button Grapher will offer a warning that the graph might be incomplete.
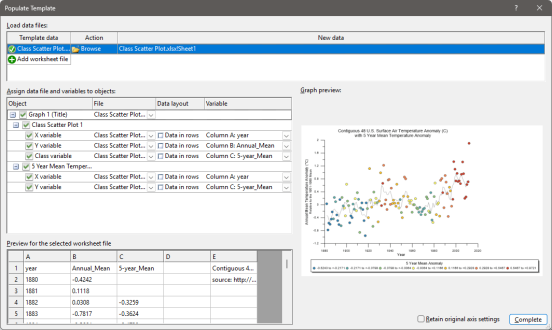
The Populate Template window with a data set loaded and ready to Complete.