Advanced Tutorial - Using the Magnifier
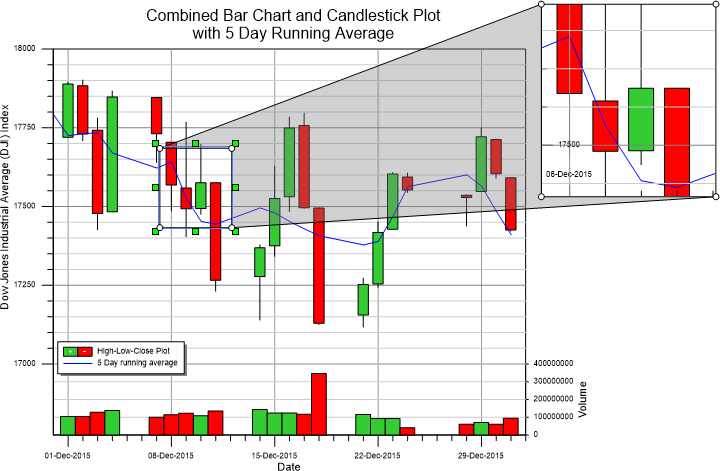
The Graph Tools | Add to Graph | Magnifier allows you to magnify a portion of a 2D graph.
To open a sample file and add a magnifier to a 2D graph:
-
Click the File | Open command.
-
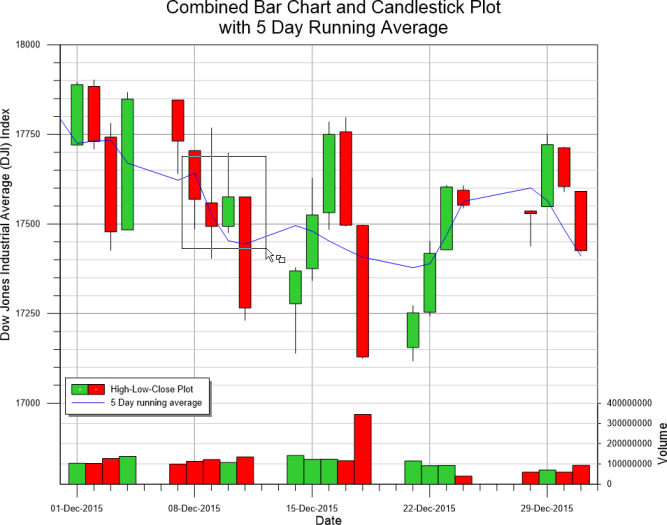
Navigate to C:\Program Files\Golden Software\Grapher\Samples, select candlestick plot.grf and click Open.
-
Select Graph 2 in the Object Manager.
-
Click the Graph Tools | Add to Graph | Magnifier command or right-click on Graph 2 and select Add Magnifier.
-
The cursor changes to
 .
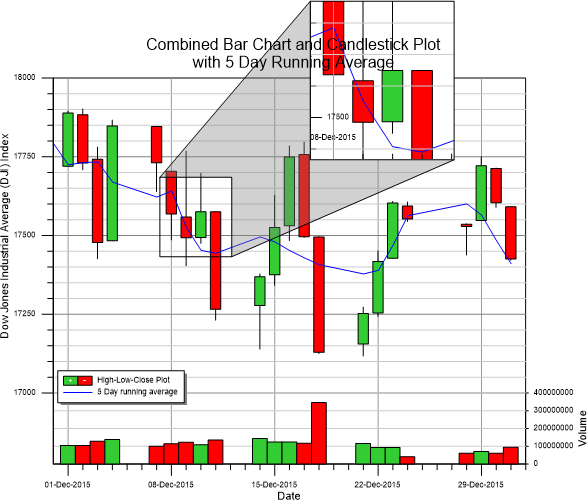
Left-click and drag to define an area to magnify.
.
Left-click and drag to define an area to magnify.
-
Release the cursor and the magnifier is created with the default settings. A Graph Magnifier 1 object is added to the Object Manager.
-
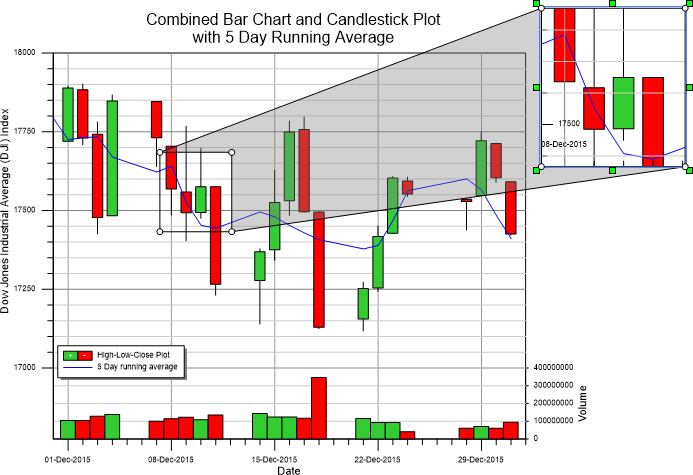
Select the Graph Magnifier 1 in the Object Manager.
-
In the Property Manager, click the Magnifier tab to display the magnifier properties. The Selected box is Zoomed area box by default. The zoomed area box has six green boxes surrounding it in the plot window, indicating it is selected. Left-click the zoomed area box and drag it to a new location.
-
Drag the lower-right green box and drag the cursor to resize the zoomed area box.
-
In the Property Manager, click the Magnifier tab to display the magnifier properties. Change the Selected box to Area selection box. The six green squares now surround the area selection box.
-
Drag a green square to resize the area selection box. The zoomed area box automatically updates to reflect the changes made to the area selection size and location.

-
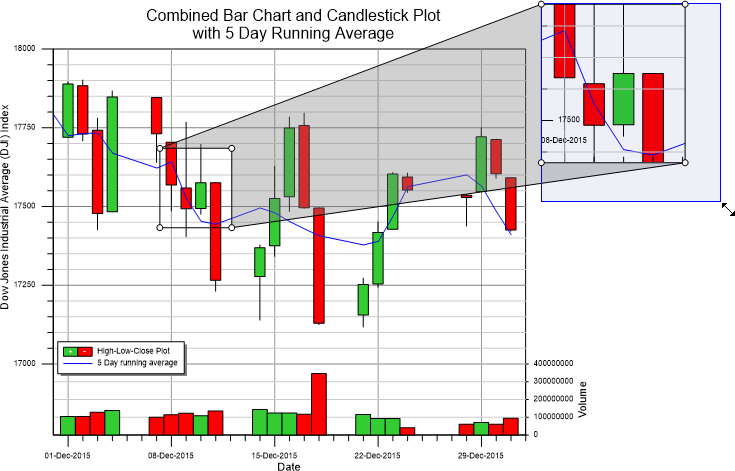
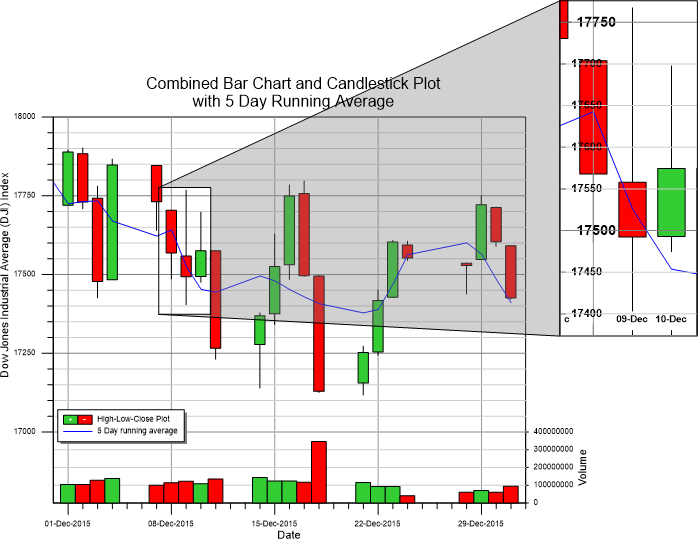
In the Property Manager, click the Tick Labels tab to display the tick labels properties. The X Axis 1 is selected by default.
-
Click the
 next
to Major Labels to
expand the major label properties.
next
to Major Labels to
expand the major label properties. -
Click the check box next to Show labels to clear the box. The major label is removed.
-
Click the
next
to Minor Labels to
expand the major label properties. -
Check the box next to Show labels. The minor labels are displayed in the magnifier.
-
Click the
next
to Font to open
the minor label font properties. -
Change the Size (points) to 12.
-
Check the box next to Bold.
-
Click the
next
to Format to
open the minor label format properties. -
Click the Select button in the Date/time format field.
-
Type dd-MMM in the Date/Time format field of the Date/Time Format Builder dialog.
-
Click OK.

-
Next to Axes, click on X Axis 1 and select Y Axis 1 from the list.
-
In the Major Labels section, expand the Font section.
-
In the Font section, change the Size (points) to 18.
-
Check the box next to Bold.
-
In the Minor Labels section, check the Show labels box.
-
In the Font section, change the Size (points) to 14.
-
Check the box next to Bold.
You have now added a magnifier and adjusted various magnifier properties. To magnify a portion of a 3D graph or polar plot, see the Using the Inset Zoom advanced tutorial lesson.
Back to Tutorial Introduction