Plot Page - Stiff Plots
The stiff plot properties Plot page contains the options to change the data file and axes; set data used in the plot; and set the plot position. To view and edit stiff plot properties, click on the stiff plot in the plot window or Object Manager to select it. Then, click on the Plot tab in the Property Manager.
Click one of the Plot page section names in the list below to read more information about the properties in those sections or follow this help topic sequentially to read about each property.
|
|
|
Change the stiff plot properties in the Property Manager on the Plot tab. |
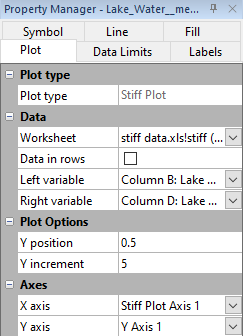
Plot Type
The Plot type property displays the type of plot.
Data
Worksheet
Click the existing data file path and file name next to Worksheet to select a different data file for the plot. Click on a currently open worksheet or click the Browse option to navigate to a worksheet that is not yet open. Select a different data file in the Open Worksheet dialog, and click the Open button to change the data. The plot automatically updates.
NOTE: The worksheet columns are retained after changing the worksheet. If any of the column options are blank after changing the Worksheet, click on the blank option and select the desired column. A blank next to column means that the column does not exist in the new worksheet.
Data in Rows
Select the Data in rows option if your data file is formatted where each row includes one variable. When the Data in rows option is selected, all plot properties that require data values are specified by selecting a data row. This includes variables such as X and Y, data labels, worksheet ranges, etc. Properties that list column letters will update to list row numbers. When switching from plotting data in columns to plotting data in rows, Grapher may not be able to select the correct rows automatically. Verify the correct rows are selected.
The property descriptions below refer to data columns, but when Data in rows is selected the property lists will include rows.
Variables
Click on the column name next to the Left variable or Right variable fields to change the columns used to create the plot. In the list that appears, select the new column. If the first worksheet row contains header information, the header information appears next to the column letter. The Left variable is traditionally the column that contains the cation concentrations. The Right variable is the column that contains the anion concentrations.
NOTE: The worksheet columns are retained after changing the worksheet. If any of the column options are blank after changing the Worksheet, click on the blank option and select the desired column. A blank next to column means that the column does not exist in the new worksheet.
Plot Options
Y Position
The Y position sets the Y axis value at which the plot begins. Note that if you have only a single stiff plot created on your graph, you may not notice a change in Y position, as the axis uses automatic spacing. This feature is more noticeable when multiple stiff plots are added to the same graph, as each stiff plot can then have a different Y position to prevent overlap between stiff plots. The Y position value is in Y axis coordinates.
Y Increment
The Y increment is the increment by which the data should be spaced on the Y axis. As with the Y position, a change in Y increment is noticeable only when there are multiple stiff plots on a single graph. The Y increment can also be used to prevent overlap between stiff plots on the same graph. The Y increment value is in Y axis coordinates.
Axes
Click on the axis name next to the X axis or Y axis fields to change the axes used for the plot. Select another axis name from the list. Alternatively, click Select plots/axis to change the axis used by several plots on a graph at once.
See the Axis - Add to Graph page for information about how to add a new axis to the graph. Once the new axis is added to the graph, it will be available in the X axis or Y axis lists.