Box Plot Data
Box plot data should be organized with each variable in it's own column or row, creating a single box plot for each distinct set of data. In the example graph shown below, Set 1, Set 2, Set 3, and Set 4 are the four sets of data. Box plots are ideal for making comparisons between distinct data sets such as these.
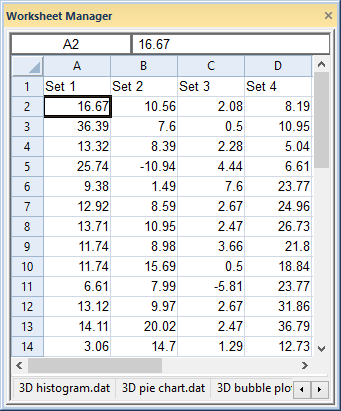
This sample data set displays four categories.

Each column of data is plotted
as a box and whiskers.
Grouped box plot data takes advantage of a category variable to break out a single column or row of data into multiple groups, creating a box plot for each group. In the example below three box plots are created for Set 1, each corresponding to a different Location.
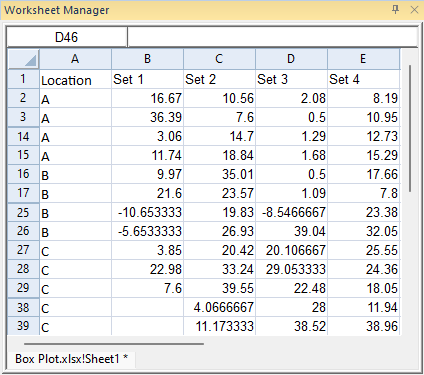
This sample data set displays four categories and three locations.
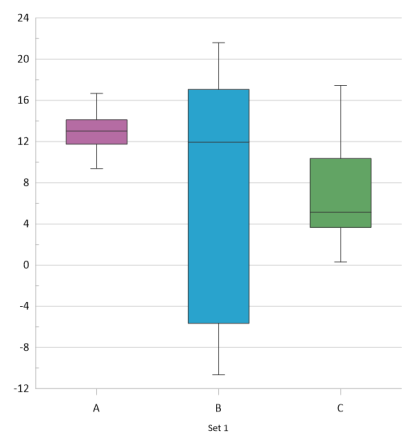
Each group is plotted as a box and whiskers
Additionally, if multiple Sets are included, these same groups can all be generated for all of the chosen data sets (as shown in this example).
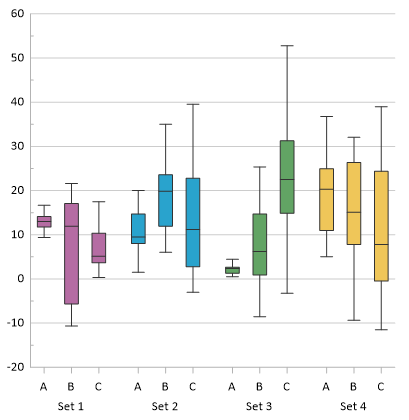
Each location is plotted as a box and whiskers grouped by data set