Choose Axes
You can select axes for the new plot in the Choose Axes dialog when adding a new plot to a graph by using the Graph Tools | Add to Graph | Plot command. Or, right click on the plot in the Object Manager, choose Add Plot and select a plot type from the Select Plot Type dialog.
The Choose Axes dialog is accessible after choosing a plot type.
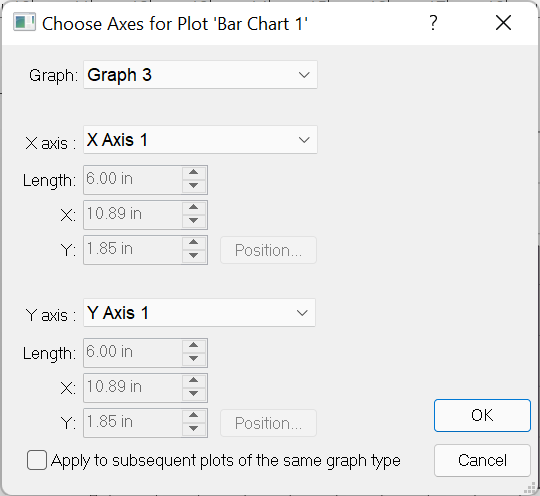
|
| Select axes for a new plot in the Choose Axes dialog. |
Graph
Select a graph from the Graph drop-down list.
Axis List
Select an X or Y axis from the lists in the X Axis or Y Axis groups. Alternatively, you can create a new axis by selecting the Create new axis option from the list. If you are working with a 3D XYZ-type plot, you can select a Z axis from the Z Axis group or create a new axis.
Create New Axis
If the Create new axis option is selected from the axis list, the length, starting position, and positioning options are available:
- Change the axis length by typing a new number into the Length box.
- Set the horizontal (X) and vertical (Y) starting positions of the axes by typing new numbers into the X and Y boxes.
- Click the Position button to position the axis relative to other axes or to position the axis according to data values.
Apply to Subsequent Plots
Select the Apply to subsequent plots of the same graph type to apply these settings to all plots that are currently being moved or created. This option is useful when you are moving or copying multiple plots and want them to use the same Axes in the destination graph. When the Apply to subsequent plots of the same graph type option is not selected, the Choose Axes dialog is displayed for each plot.