Creating a Scatter Plot
To create a line plot in a new plot window:
-
Click the File | New | Plot command.
-
Click the Home | New Graph | Line/Scatter | Scatter Plot command.
-
The Open Worksheet dialog appears. Browse to Grapher's Samples folder. The location of this folder varies depending on where the software was installed. If the software was installed in the default folder, the path is C:\Program Files\Golden Software\Grapher\Samples.
-
Click Open to create the default graph and scatter plot.
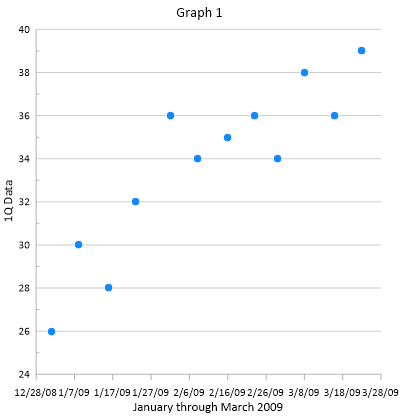
A scatter plot is created with the first two available columns using the default properties. Grapher can create graphs from data containing date/time information. In this example, column A contains dates, so dates are plotted on the X axis.
|
|
The graph is created with the default properties. |
Back to Start Recording