Changing the X Axis Date/Time Tick Mark Spacing
Tick marks can be spaced at any desired interval. Tick marks can be changed to show one tick mark every X number of units or can be based on date/time units, such as minutes, days, months, or years. To set the tick marks to display one tick and label per month:
-
Click on the X Axis 1 in the Object Manager to select it.
-
In the Property Manager, click on the Ticks tab to display the tick mark properties.
-
Click the
 to the left of the Major Ticks
section to expand the major tick options, if necessary.
to the left of the Major Ticks
section to expand the major tick options, if necessary. -
Check the box next to the Use date/time spacing option in the Major Ticks section.
-
Next to Date/time spacing, click Every Year to open the Date/Time Spacing dialog.
-
Change Year to Month and click OK.
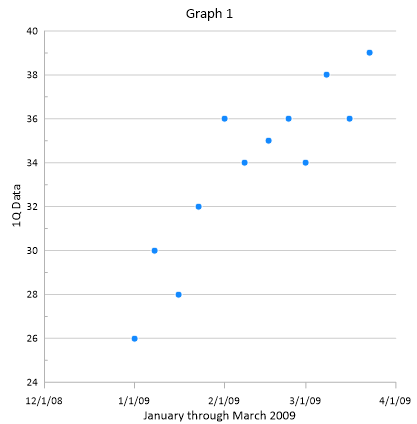
The X Axis major tick marks are now displayed at 1/1/09, 2/1/09, 3/1/09, and 4/1/09.
|
|
|
The X Axis tick mark spacing can be based on date/time units. |
Back to Creating a Line/Scatter Plot