Changing the X Axis Date/Time Limits
- Tutorial
The axis limits can use the default limits or can be changed to show only a portion of the graph. Limits can be based on numerical values or on date/time values. To change the X Axis limits using date/time values:
-
Click X Axis 1 in the Object Manager to select it.
-
In the Property Manager, click on the Axis tab to display the axis properties.
-
Click the
 to the left of the Limits section to expand the axis
limits.
to the left of the Limits section to expand the axis
limits. -
Click the
 next to the
12/18/2008 0:00:00 value next to Minimum
date/time to open the Select
Date/Time dialog.
next to the
12/18/2008 0:00:00 value next to Minimum
date/time to open the Select
Date/Time dialog. -
Change the date to 1/1/2009 and click OK.
-
Dates can also be edited directly in the Property Manager. Highlight the 3/28/2009 value next to Maximum date/time and type 4/1/2009 and press ENTER.
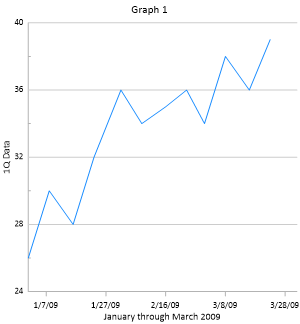
The X Axis limits now range from 1/1/2009 to 4/1/2009. Date/time values can be displayed in any format on axis and plot labels and in the worksheet. However, M/d/yyyy h:mm:ss format must be used when entering date/time values in the Property Manager.
|
|
|
The axis updates to the new date/time limits. |
Back to Creating a Line/Scatter Plot