Changing the Tick Mark Spacing
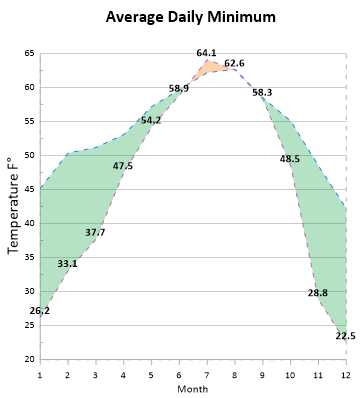
Tick marks are a means of indicating units of measure and are typically equally spaced like the lines on a ruler. Tick marks are the lines that emerge perpendicularly from an axis. Normally, the major tick marks are longer and the minor tick marks are shorter and appear between the major tick marks. For example, in the tutorial graph the major tick mark spacing on the Y axis is five units, e.g., 40, 45, 50, etc. In addition, there is a single unlabeled minor tick mark between each set of major tick marks. In the following exercise, the tick spacing is changed to one for the X axis. To change the tick mark spacing:
-
Click on the X Axis 1 in the Object Manager to select it.
-
In the Property Manager, click the Ticks tab to open the tick mark properties.
-
Click the
 next to Major Ticks, if necessary.
 -
Change the Spacing from 2 to 1. To change the Spacing, highlight the existing number 2, type the new number 1, and press ENTER on your keyboard. The word Auto is automatically replaced with the word Custom, indicating a custom spacing value.
-
Click the
next to Minor Ticks, if necessary. If either
the Show ticks on top or
Show ticks on bottom options
are selected in the Minor Ticks
section, clear the check boxes.
Now the major tick marks spacing is 1, and no minor tick marks are displayed.
|
|
You can customize the axis properties, including changing the tick mark spacing. |
Back to Lesson 3 - Editing Axes
Next to Changing Tick Labels