Adding Linked Text to the Graph Title
- Tutorial
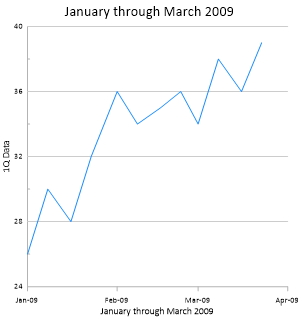
Titles can be used to indicate the information contained in graphs. In this file, cell A1 contains the data's time range, January through March 2009. The next quarter's data file will contain April through June 2009. With linked text, the information is updated on the graph any time the information changes in the cell in the data file. When the script is run, the date in the data file appears on the graphs.
To add linked text information to the graph title:
- Select Graph 1 in the Object Manager.
- Click the Title tab in the Property Manager to open the graph title properties.
- Next to Text, click the
 button to open the Text Editor.
 - Delete the Graph 1 text in the Text Editor.
- Click the
 button to select the worksheet that contains the text.
 - In the Open Worksheet dialog, select the tutorial script recorder.xls file from the Open worksheets section and click Open. The worksheet name is updated in the Text Editor.
- Click the
 button in the Text Editor. Type A1 into the Enter Cell dialog and click OK. <<@A1>> appears in the Text Editor.
 - Highlight all of the text in the Text Editor. Change the size of the text to 24 by typing 24 in the size box or clicking the
 next to the size box to change the size to 24. The font size box is located to the right of the font name.
 - Change any other properties, such as text color, if desired.
- Click OK in the Text Editor to close the dialog and apply the changes.
Although we could add many more features to the graph, we will stop here. Feel free to experiment with adding or editing features and observing the script in the Script Manager.
|
|
|
Add the graph title with inserted text. |
Back to Changing the X Axis Date/Time Tick Label Format
Next to Exporting the Graph