Options - Plots
You can set defaults such as file open/save paths, page units, undo
levels through the File | Options
command. In the Options dialog,
click the ![]() button next to Environment to
expand the Environment section
to access these items. Changes made in the Options
dialog affect all subsequent documents. Existing documents and settings
are not changed.
button next to Environment to
expand the Environment section
to access these items. Changes made in the Options
dialog affect all subsequent documents. Existing documents and settings
are not changed.
The Environment section has the following sub-sections: Display, Rulers and Grid, Selection, Plots, and Dialog Messages. Click Plots on the left side of the dialog to display the Plots options on the right side of the dialog. Use the Plots options to show plot values using the mouse, to track worksheet values when clicking on graphs, and to set the 3D rotation mode.
|
|
|
Use the Options dialog to set Grapher preferences. |
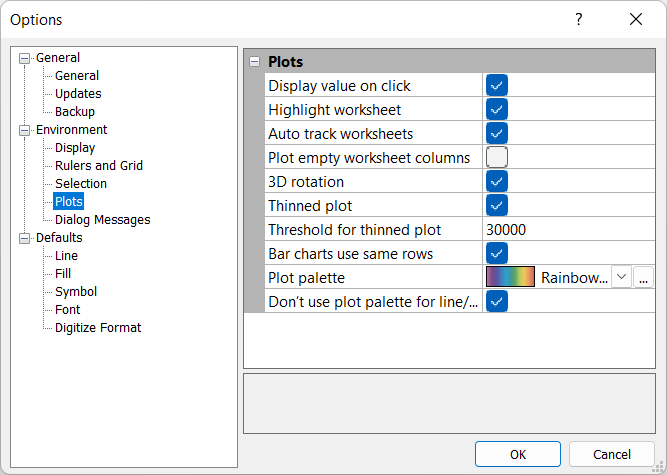
Display Value On Click
If Display value on click is checked, the data point value is displayed in the status bar when clicking on a data point. To display the value, select the plot, then click and hold the left mouse button on a data point. The value of the point is displayed in the status bar as long as the mouse button is held down and the mouse is not moved. Note that only points obtained from the worksheet are displayed. Click the Graph Tools | Digitize | Digitize or Graph Tools | Digitize | Digitize Fixed commands to obtain the values of intermediate points on the graph. This feature is available with line/scatter, step, bubble, function, ternary, bar chart, floating bar, histogram, and polar plots.
Highlight Worksheet
If Highlight worksheet is checked, the worksheet cells used by a data point are selected when a data point is clicked. This feature is available with line/scatter, class scatter, step, bar chart, floating bar chart, polar, polar class scatter, polar bar chart, bubble, ternary, vector, 3D ribbon/wall, 3D step, 3D bar chart, 3D floating bar chart, 3D XYZ line/scatter, 3D XYZ class scatter, and 3D XYZ bubble plots.
Auto Track Worksheets
If the Auto track worksheets command is checked, changes made in the Grapher worksheet are automatically updated on the graph. If Auto track worksheets is unchecked, changes made to the worksheet do not show on the graph. This command only applies to changes made in the Grapher worksheet. If changes are made in a program other than Grapher, use the File | Reload Data command.
Plot Empty Worksheet Columns
Select the Plot empty worksheet columns option to display all worksheet columns between the first and last column with data regardless if each column includes data. The empty columns can be selected for use in a plot in the Data section of the Property Manager Plot page for the various plots. However, no plot is displayed if an empty column is selected for one of the Data properties. This option can be useful when creating a template if your data file does not always include all the data, but data are consistently located in the same column when available.
3D Rotation
The 3D rotation option provides 3D virtual rotation with the mouse. When the 3D rotation option is checked, the Free Rotate command rotates 3D graphs by rotating the graph in relation to the plot window point of view in the direction the mouse is dragged. When the 3D rotation option cleared, the Free Rotate command rotates 3D graphs about the Y axis when the mouse is dragged left or right and rotates 3D graphs about the X axis when the mouse is dragged up or down.
Thinned Plot and Threshold for Thinned Plot
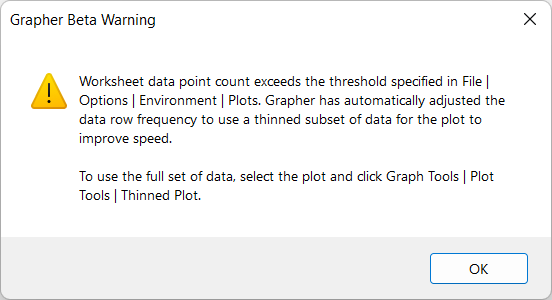
The Thinned plot and associated Threshold for thinned plot options are used to speed up the drawing of plots with a large number of points. If the Thinned plot option is selected, a new plot is automatically thinned and a warning is displayed when the plot source data points exceeds the Threshold for thinned plots.
|
| A waring is displayed if a newly created plot is thinned. |
The plot thinning is performed by increasing the default Frequency value on the Data Limits page for the plot until the Data points count is less than the Threshold for thinned plot value.
Clear the Thinned plot option to create plots with all data points by default. This will disable the Thinned Plot command in the Graph Tools tab. Manual plot thinning can still be performed by adjusting the Frequency value on the Data Limits page in the plot properties when the Thinned plot option is disabled.
Bar Charts Use Same Rows
If the Bar charts use same rows option is checked, grouped bar charts will use the same worksheet rows for all grouped bar charts. When one bar chart changes the rows, all bar charts in the group are changed. When unchecked, each bar chart is able to set different values for the worksheet rows.
Plot Palette
The Plot palette is the color gradient that controls the color of new plot line, fill, and/or symbol colors when adding new plots via the Create button on the Plot page in the Property Manager. New plots will sample their colors from the Plot palette color gradient from left to right. For example, the first line plot will use the default color, the second plot will be gray, and the subsequent plots will vary along the rainbow from violet to red with the default Plot palette color gradient.
Don't Use Plot Palette
Check the Don't use plot palette for line/scatter plots box to not use the Plot palette (see above) when coloring lines for additional line plots added to an existing plot. This checkbox applies to line, line/scatter, xyz line, step, 3D ribbon, 3D step, and 3D wall plots. If this box is checked, all lines added using the New plotCreate button in the Plot tab of the Property Manager will be colored using the line color specified for that plot type in File | Defaults. If the box is not checked, added lines will use the colormap gradient (Plot palette) specified in File | Options.