Plot Page - Wind Charts
The wind chart plot properties Plot page contains the options to change the data file, set the bin size, set the wind speed bins, and set bar properties. To view and edit wind chart plot properties, click on the wind chart plot in the plot window or Object Manager to select it. Then, click on the Plot tab in the Property Manager.
|
|
|
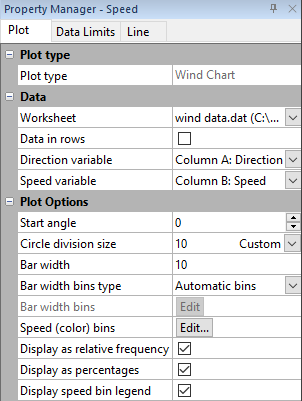
The wind chart options are edited in the Property Manager on the Plot tab. |
Plot Type
The Plot type property displays the type of plot.
Worksheet
Click the existing data file path and file name next to Worksheet to select a different data file for the plot. Click on a currently open worksheet or click the Browse option to navigate to a worksheet that is not yet open. Select a different data file in the Open Worksheet dialog, and click the Open button to change the data. The plot automatically updates.
NOTE: The worksheet columns are retained after changing the worksheet. If any of the column options are blank after changing the Worksheet, click on the blank option and select the desired column. A blank next to column means that the column does not exist in the new worksheet.
Select the Data in rows option if your data file is formatted where each row includes one variable. When the Data in rows option is selected, all plot properties that require data values are specified by selecting a data row. This includes variables such as X and Y, data labels, worksheet ranges, etc. Properties that list column letters will update to list row numbers. When switching from plotting data in columns to plotting data in rows, Grapher may not be able to select the correct rows automatically. Verify the correct rows are selected.
The property descriptions below refer to data columns, but when Data in rows is selected the property lists will include rows.
Data
Click on the column name next to the Direction variable property and the Speed variable property to change the data used to create the plot. In the list that appears, select the new column. If the first worksheet row contains header information, the header information appears next to the column letter.
NOTE: The worksheet columns are retained after changing the worksheet. If any of the column options are blank after changing the Worksheet, click on the blank option and select the desired column. A blank next to column means that the column does not exist in the new worksheet.
Bin Start Angle
The Start angle property shows the beginning number for the first bin. This value is in degrees. By default, this value is 0. By changing the starting location, you can create a bin which overlaps the 0 degree direction. For example, if you are using bins 20 degrees in size, setting the Start angle value to 10 degrees results in the final bin covering the arc from 350 to 10 degrees.
Circle Division Size
The Circle division size property controls the "width" of the bin. The size is shown in degrees. When Auto is selected for the Circle division size, the circle division size is the same as the Bar width. To return the Circle division size to the default value, click on the word Custom and select Auto from the list. The value automatically changes to equal the Bar width. The Circle division size must be equal to or smaller than the Bar width.
Bar Width
Bar width controls the range of angle values contained in each bar in the rose diagram, i.e. the automatic bin size. The Bar width is shown in degrees. Bar width is not available when Bar width bins type is set to Custom bins.
The first automatic bin starts at the Start angle. Each additional bin begins at slightly greater than the next bin value, which is calculated by adding the Start angle and the Bar width. All bins include the maximum value for that bin.
Bar Width Bins Type
The Bar width bins type property can be used to set the wind chart direction bins to be automatic or custom. Setting the Bar width bins type to Automatic bins results in adjacent bars that cover all the data in the polar circle. Automatic bins use the value in the Bar width property to determine the bin size of each bar.
Setting the Bar width bins type to Custom bins, allows the user to set the minimum and maximum value for each bar individually. To create custom bins, change the Bar width bins type to Custom bins. Click the Edit button next to the Bar width bins command to display the Custom Bins dialog to set the custom values.
Custom Bins
To set the bin ranges individually select Custom bins from the Bar width bins type list and then click the Edit button next to Bar width bins to open the Custom Bins dialog.
Speed Bins
To set the wind speed ranges and colors in the Wind Speed Bins dialog, click the Edit button next to Speed (color) bins.
Relative Frequency
To display data values as relative frequency rather than the total number of observations in a bin, select the Display as relative frequency option. When this box cleared, bars display the total number of counts from the Data column in each bin.
Display as Percent
To display wind chart data values as percentages rather than decimal numbers on the radial axis, check the box next to the Display as percentages option. When this box is checked, the values are displayed in the form of n%. This option is only available when the Display values as relative frequency box is checked.
Clipping on Polar Wind Chart
Wind charts are either clipped or not clipped based on the Data Limits Clip to polar circle property.