Plot Page - Bubble Plots
The bubble plot properties Plot page contains a variety of options to customize 2D bubble plots, ternary bubble plots, and 3D XYZ bubble plots, such as changing the data file and axes, setting data used in the plot, setting bubble properties, adding a bubble plot legend, and adding a new plot to the graph. To view and edit bubble plot properties, click on the bubble plot in the plot window or Object Manager to select it. Then, click on the Plot tab in the Property Manager. Depending on the plot type, a bubble plot, ternary bubble plot, or XYZ bubble plot properties page will appear.
Click one of the Plot page section names in the list below to read more information about the properties in those sections or follow this help topic sequentially to read about each property.
|
|
|
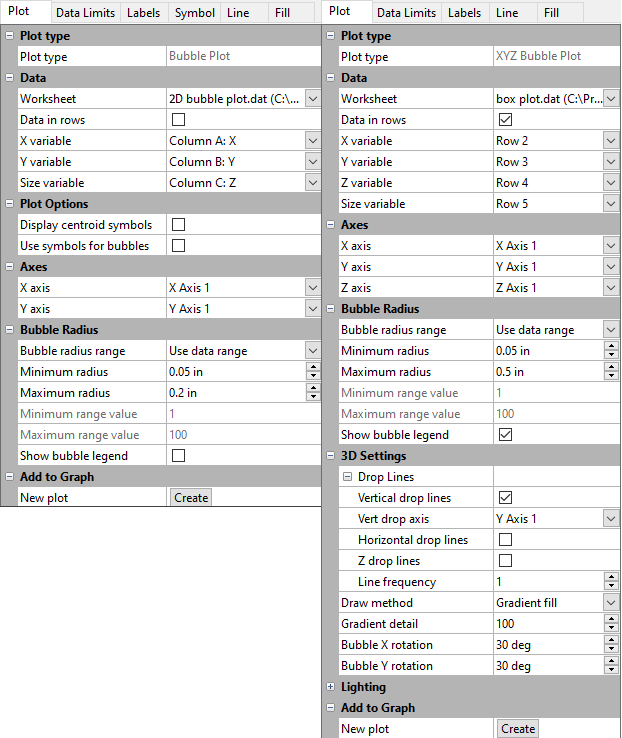
2D and 3D XYZ bubble plot properties in the Property Manager on the Plot page |
Plot Type
The Plot type property displays the type of plot.
Data
Worksheet
Click the existing data file path and file name next to Worksheet to select a different data file for the plot. Click on a currently open worksheet or click the Browse option to navigate to a worksheet that is not yet open. Select a different data file in the Open Worksheet dialog, and click the Open button to change the data. The plot automatically updates.
NOTE: The worksheet columns are retained after changing the worksheet. If any of the column options are blank after changing the Worksheet, click on the blank option and select the desired column. A blank next to column means that the column does not exist in the new worksheet.
Data in Rows
Select the Data in rows option if your data file is formatted where each row includes one variable. When the Data in rows option is selected, all plot properties that require data values are specified by selecting a data row. This includes variables such as X and Y, data labels, worksheet ranges, etc. Properties that list column letters will update to list row numbers. When switching from plotting data in columns to plotting data in rows, Grapher may not be able to select the correct rows automatically. Verify the correct rows are selected.
The property descriptions below refer to data columns, but when Data in rows is selected the property lists will include rows.
Variables
Click down arrow next to the X variable, Y variable, Z variable, or Size variable lists to change the data columns used to create the plot. If the first worksheet row contains header information, the header information appears next to the column letter. Size variable is used as the bubble size. In 3D XYZ bubble plots, the Z variable is a dimension.
In addition to the data columns there are two other options: Row number and Sequence number.
- Selecting the Row number option plots the axis with the row numbers used in the Worksheet section. For example, if the first row is number two, the axis begins at a value of two.
- The Sequence number option plots the data according to the total number of rows used. The sequence number always begins with the number one regardless of which rows are selected. Blank lines between rows are ignored when calculating the value. The sequence number increments by one when rows are adjacent or when rows are skipped.
When changing the X variable, Y variable, or Z variable to date/time data from numeric data, the Use date/time format option for the corresponding axis Tick Labels will automatically be checked to match the new data. When changing the X variable, Y variable, or Z variable to numeric data from date/time data, the Use date/time format option for the corresponding axis Tick Labels will automatically be unchecked to match the new data.
NOTE: The worksheet columns are retained after changing the worksheet. If any of the column options are blank after changing the Worksheet, click on the blank option and select the desired column. A blank next to column means that the column does not exist in the new worksheet.
Plot Options
Bubble Centroids
The centroid location for each bubble can be displayed as a symbol on 2D bubble plots. This symbol is not scaled, and sometimes it is easier to distinguish overlapping bubbles when the centroid is visible. Check the box next to the Display centroid symbols to show the XY location of the data point as a symbol. Centroid symbols can be customized, see the Symbols - 2D Bubble Plots help topic for more information.

|
| Symbols can be displayed on the bubble's X, Y location. |
Bubble Symbol
By default, the symbols in the bubble plot are open circles, but the bubble symbol can be customized. To switch from the default bubble symbol and show customized bubble symbols, check the Use symbols for bubbles check box in the Plot Options section of the Plot page properties. Define the bubble symbol in the Symbol property page. Set the bubble line and fill color in the Line tab and Fill pages in the Property Manager.
Axes
In a 2D or 3D XYZ bubble plot, click on the axis name next to the X axis, Y axis, or Z axis fields to change the axes used for the plot. Select another axis name from the list. Alternatively, click Select plots/axis from the list to change the axis used by several plots on a graph at once. See the Axis - Add to Graph page for information about how to add a new axis to the graph. Once the new axis is added to the graph, it will be available in the X axis, Y axis, or Z axis lists.
Bubble Radius
There are two ways to define the bubble radius range, using a fixed range or using a data range.
Fixed Value Based Bubble Radius Range
Next to the Bubble radius range option, select Use fixed range to set the radius range based on user-defined data values. Use this method when you have multiple data sets in a similar range and would like to have the same data values represented by the same bubble size with each plot.
When the Bubble radius range is set to Used fixed range, enter a Minimum range value and Maximum range value. The Minimum range value is assigned to the Minimum radius size, and the Maximum range value is assigned to the Maximum radius size. Each bubble's radius is then calculated by the bubble’s data value and where it falls between the minimum and maximum data values. The Minimum radius and Maximum radius values are in page units.
Data Based Bubble Radius Range
Set the Bubble radius range option to Use data range to automatically use the data's minimum and maximum values for determining bubble size. With this method, the smallest value in the Z column for 2D bubble plots or the Size column 3D XYZ bubble plots is displayed as the Minimum radius value. The largest value in the Z column for 2D bubble plots or the Size column for 3D XYZ bubble plots is displayed as the Maximum radius value. Intermediate values are displayed proportionally between these two values. The Minimum radius and Maximum radius values are in page units.
Radius Formula
The formula used for bubble size by both methods is:
Br = ((Z - Zmin)/(Zmax - Zmin)) * (Rmax - Rmin) + Rmin
where:
When using the Use data range method, the Minimum radius is the smallest bubble ever drawn. Similarly, the Maximum radius is the largest bubble ever drawn. When using the Use fixed range method, the bubble radii may be smaller or larger than the Minimum radius or Maximum radius sizes should any bubble’s data value be either smaller or larger than the Minimum range value or Maximum range value entries.
3D Settings
The 3D Settings section is displayed for an XYZ bubble plot and includes options for displaying drop lines and modifying 3D bubble appearance.
Drop Lines
3D XYZ plots have vertical, horizontal, and Z drop line options. When the box next to the Vertical drop lines option is checked, lines are drawn from the points to the bottom wall (XZ plane). When the box next to the Horizontal drop lines option is checked, lines are drawn from the point to the side wall (YZ plane). When the box next to the Z drop lines option is checked, lines are drawn from the point to the back wall (XY plane).
Drop Axis
When the Vertical drop lines or Horizontal drop lines box is checked, you can choose the plane to which the lines are drawn. Drop lines are drawn from the data point to the plane that intersects the drop axis minimum.
- For vertical drop lines, the XZ plane to which the drop lines are drawn is specified by the Vert drop axis minimum location.
- For horizontal drop lines, the YZ plane to which the drop lines are drawn is specified by the Horz drop axis minimum location.
- Z drop lines are always drawn to the XY plane at the Z axis maximum. There is no Z drop axis property.
Drop Line Frequency
If there are many drop lines, you can change the frequency the lines are drawn by entering a new number into the Line frequency box. For example, if Line frequency is set to 5, every fifth line is plotted on the plot. To remove all of the lines, set the Line frequency to a number greater than the total number of data points. Up to 10,000 points may be skipped.
Drop Line Properties
The drop line properties can be individually controlled with the Vert drop line properties, Horz drop line properties, and
Z drop line properties sections
on the Line page. Click
the ![]() next to the appropriate
section to open the line properties options. The Style,
Color, Opacity, and Width
can be changed for the drop lines.
next to the appropriate
section to open the line properties options. The Style,
Color, Opacity, and Width
can be changed for the drop lines.
Draw Method and Color
There are three methods for drawing 3D bubbles. Next to the Draw method property, select Wire frame 1, Wire frame 2, or Gradient fill.
The wire frame methods draw lines on the bubbles. Line color and line opacity are controlled on the Line page, and the background fill color and fill opacity are controlled on the Fill page. The Line opacity and Fill opacity control the amount of transparency for the wire frame lines and fill colors. The number of lines drawn on the bubbles is determined by the Wireframe line count property. You can draw between 10 and 100 lines on each bubble.
When the Draw method is set to Gradient fill, the bubble is drawn with a color gradient across the bubble. Select or edit the color gradient Colormap on the Fill page. When using gradient fill, the Gradient detail option is also available. The Gradient detail determines how finely the gradient is drawn. You can set the Gradient detail between 10 and 1000. Lower numbers draw the gradient coarsely and higher numbers draw the gradient smoothly. The higher the value, the longer it takes to refresh the graph.
Rotation
Use the Bubble X rotation and Bubble Y rotation settings to rotate the bubbles in the X and Y directions. Rotation values are in degrees. A positive rotation in the Bubble X rotation rotates the bottom of the bubble forward toward the screen. A positive rotation in the Bubble Y rotation rotates the front of the bubble clockwise.
Lighting
The Lighting properties section includes the 3D lighting properties: style, direction, color, and shininess.
Add to Graph
In a 2D or 3D XYZ bubble plot, click the Create button next to the New plot command to create a new plot based on the current data file. A new plot is created using the same X variable and Y column as the selected plot. The Size variable changes to the next column in the worksheet that contains data. For example, if a selected bubble plot uses column A for X values, column B for Y values, and column C for size values, clicking Create generates a new bubble plot with column A for X values, column B for Y values, and column D for size values.
The new bubble plot is selected so you can change the new plot's properties. The line, fill, and/or symbol color automatically changes to a new color for 2D bubble plots. The Plot palette option on the Options dialog Plots page controls the colors for plots added via the Create button in the Plot page.